Writeup Series Charter and Persistent Metric Protocol
Editorial Control Document for the Complex-Wavelet Earthformer ENSO Series
Abstract
This document is the editorial companion to a standalone publication and nine scientific reports produced by the Complex-Wavelet Earthformer ENSO project. It defines the document series, the evidence hierarchy that separates engineering checks from held-out forecast claims, the metric identifiers that remain stable across all papers, and the comparability rules that prevent results obtained under different estimators, splits, or centering conventions from being ranked in a single undifferentiated column. It is not itself a scientific report: it contains no new results, and it should be revised only when a metric definition or a document boundary changes. All numeric values quoted here are anchors copied from the project's append-only validation ledger and frozen protocol documents; where a recorded value was later found to be affected by a scoring defect, both the archived and the audit-corrected values are given, with the archived value retained solely as the historical decision record.
1. Purpose of the Series
The project produced two kinds of knowledge that do not survive being flattened into one narrative. The first is a small number of confirmatory results obtained under sealed, hash-gated protocols—above all a deterministic forecast-skill result on a test period consulted under a written one-shot rule. The second is a much larger body of controlled development evidence: ablations, negative results, statistical governance decisions, and diagnostic audits accumulated on a repeatedly consulted validation period. A single publication that tried to carry both would either bury the confirmatory result under process detail or launder exploratory evidence into apparent confirmation.
The series therefore consists of one standalone publication and nine independent reports, each of which owns a phase of the work. Every report must state, in its opening section: (i) its incoming baseline, (ii) the single factor or factor family it changes, (iii) its predeclared gates, (iv) its terminal decision, and (v) the artifact it hands to the next report. This continuity rule is what makes the reports independently readable while remaining one auditable arc.
2. Document Map
The intended reading order is thematic, not strictly chronological:
- Publication (Complex-Wavelet Earthformer Forecasting of Tropical-Pacific Sea-Surface Temperature: Development-Period Skill and the Behavior of a Residual-Diffusion Ensemble): the final-generation deterministic and probabilistic products in the relative-SST-anomaly frame, fitted on 1981–2020 observations and characterized on 2021–2025 development-validation windows. It is written for an external audience, is deliberately self-contained, and does not use the internal phase framework or the generation-1 anchors of this charter; its numbers must never be ranked against the anchor rows of Section 6, which live in a different reference frame and chronology.
- Report 1: data pipeline, wavelet representation, Earthformer integration, and engineering/scientific validity gates.
- Report 2: coefficient-native deterministic ablations and the diagnosis of smoothing, amplitude loss, and persistence cancellation.
- Report 3: self-supervised coefficient pretraining V0–V7, the reconstruction-to-forecast transfer gap, statistical governance, and Phase A.
- Report 4: supervised CMIP6 forecast pretraining, the PB-1 transfer, and the first pristine, hash-gated sealed test.
- Report 5: the controlled OHC300 simulation-to-observation transfer study (a rigorous negative).
- Report 6: factorized Gaussian, latent-noise, and spatial diffusion ensembles in Phases D–E.
- Report 7: projection-space calibration, analogs, conditional variance, and coherent lowpass lifting in Phase F.
- Report 8: temporally joint sequence diffusion, band-weighted objectives, longer CMIP pretraining, the adopted probabilistic stack, and its second and final amended sealed-test consultation in Phase G.
- Report 9: the stale-reference finding of Phase H, the controlled anomaly-reference study of Phase J (fixed, trailing, relative-SST, and detrended references under one frozen recipe), the corrected retraining-versus-reference attribution, and the live-deployment handoff.
Calendar order differs from reading order in several places, and every report must carry a one-line incoming/outgoing timeline so the thematic grouping is not misread as execution order (Fig. 1). Specifically: Phases C (Report 5) and D (the first half of Report 6) were completed after PB-1 selection but before the first test read; Phases E–G developed after that read, on 1981–2015 data only; and the adopted G2-long product then used the one predeclared second and final test consultation on 12 July 2026. Report 9 and the publication postdate that sequence: Phases H–J re-based the observational record and anomaly reference, spent the 2021–2025 period for the frozen earlier generations under a second written one-shot override (E5-TEST, Section 3), and selected the relative-SST deployment contract; the publication's products are the final clean reconstruction of that contract, trained through 2020 with 2021–2025 as repeatedly consulted development validation.
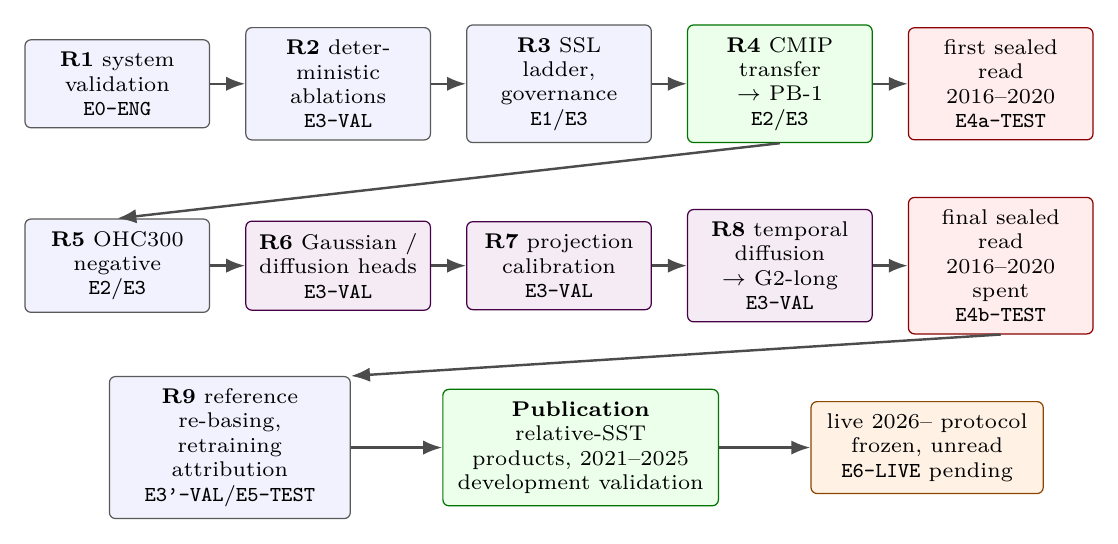
3. Evidence Hierarchy and Claim Labels
Every main result table and every abstract-level claim in the series carries one of the following labels. The hierarchy exists to prevent later drafting from flattening engineering checks, simulation results, observed validation, and two differently weighted reads of one test period into a single evidence category.
E0-ENG- Network-free or bounded engineering evidence: tensor shapes, transform roundtrips, gradient boundaries, checkpoint loading, masks, and fail-closed data access. Never described as forecast skill.
E1-TRAIN- Training-only or pretext-task evidence, including masked reconstruction diagnostics. Never described as observed forecast skill.
E2-SIM- Held-out climate-model evidence. Whole source models, rather than overlapping windows alone, define the generalization boundary.
E3-VAL- Observed 2011–2015 development-validation evidence. Every E3 claim states the degree of validation reuse and whether the comparison was predeclared, bootstrap-tested, or fitted with leave-one-start-year-out (LOYO) evaluation.
E4a-TEST- The pristine, first hash-gated evaluation of PB-1 on 2016–2020, executed once on 6 July 2026 after the A–D selection record was frozen in writing. This is the strongest confirmatory tier in the project.
E4b-TEST- The adopted G2-long stack's predeclared second and final hash-gated consultation of the same 2016–2020 period, executed once on 12 July 2026. It is genuine held-out evidence, but it carries less confirmatory weight than
E4a-TESTbecause Phases E–G exercised many more researcher degrees of freedom on repeatedly consulted validation before adoption. E3'-VAL- Post-
E4reuse of the 2016–2020 period as development validation by later model generations (Phase H onward, Report 9). The period is out of training sample for the models scored on it, but it is non-pristine — its behavior was already known project-wide from theE4reads — so it carries validation weight only and can never be described as held-out test evidence. E5-TEST- The single authorized one-shot read of 2021–2025 (frozen 13 July 2026 under a written override amendment), evaluating the frozen generation-1 and Phase-H products. Spent on execution; every later 2021–2025 recomputation for those generations is audit-only and reported-not-confirmatory. For the final-generation products of the publication, 2021–2025 is repeatedly consulted development validation, not
E5evidence: those products' checkpoints were selected on it. E6-LIVE- Prospective evidence on months that postdate every training, selection, and calibration decision (2026 onward), under the frozen live protocol handed off in Report 9. No
E6evidence exists yet, and no document may cite this tier until the live products' checkpoint hashes and protocol are frozen and the verifying months have passed.
Authoritative status distinction. PB-1 holds the pristine E4a result. G2-long was first adopted on E3-VAL by explicit user direction after its strict calibrated-CRPS gate missed under the archived scorer ($+0.0095$; corrected audit $+0.0067$) and the gate was waived; only then was its E4b evaluation authorized by a written amendment and executed once. The mixed E4b outcome did not confirm the stronger validation advantages. The 2016–2020 split is now fully spent under the written protocol: no further test read of any model is authorized by any document. Note that the runtime SHA-256 gate verifies the declared checkpoint and authorizing document but is not a global execution counter; finality is a governance property of the amendment plus the append-only ledger, not a mechanical property of the code. The same governance now covers 2021–2025: its one E5-TEST read is spent, and Report 9 stamps every later recomputation on that period audit-only.
4. Fixed Experimental Coordinates
Every report that evaluates forecasts repeats these coordinates verbatim, so that readers can compare papers without reconstructing the protocol. The chronology below is the generation-1 contract shared by Reports 1–8; Report 9 re-bases it (training through 2015, reused 2016–2020 validation, audited 2021–2025), and the publication's final products use training through 2020 with 2021–2025 development validation in the relative-SST frame. The domain, forecast geometry, index definition, and baselines are invariant across all generations.
- Domain. Tropical Pacific, $30^{\circ}$S–$30^{\circ}$N and $120^{\circ}$E–$280^{\circ}$E, on an endpoint-inclusive $24\times48$ rectilinear grid ($\approx 2.5^{\circ}$ meridional $\times\ 3.4^{\circ}$ zonal).
- Forecast geometry. $T_{\mathrm{ctx}}=12$ monthly context maps and $T_{\mathrm{fc}}=14$ monthly forecast maps; a window spans 26 consecutive months and is wholly contained in one chronological split.
- Observed chronology. Training 1981-01–2010-12 (360 months, 335 windows), development validation 2011-01–2015-12 (35 fully contained overlapping windows), held-out test 2016-01–2020-12 (35 windows). The test was consulted once for PB-1 (
E4a) and, under a written bounded amendment, once for G2-long (E4b); it is now fully spent. Primary regional index. Cosine-latitude-weighted Niño-3.4 SST anomaly over $5^{\circ}$S–$5^{\circ}$N, $190^{\circ}$E–$240^{\circ}$E:
\[ N(w,\ell) \;=\; \frac{\sum_{x \in B_{3.4}} \cos\varphi_x \, y(w,\ell,x)} {\sum_{x \in B_{3.4}} \cos\varphi_x }, \](1)for window $w$, lead $\ell$, grid cell $x$ at latitude $\varphi_x$, anomaly field $y$.
- Common summary horizon. Leadwise results at months 1–14 and the mean over leads 3–14 of the cross-window Niño-3.4 correlations.
- Deterministic baselines. Last-observation persistence (the final context map repeated through all 14 leads) and zero anomaly, which in anomaly space is the calendar-month climatology forecast.
- Standard probabilistic evaluation. 32 members when a directly comparable ensemble can be generated; otherwise the member count is reported prominently in every table.
5. Persistent Deterministic Scorecard (D1–D6)
The following identifiers remain stable in the publication and all reports. A study without forecast outputs prints “not applicable” rather than substituting a convenient pretext metric. All field metrics use the valid-cell mask; ACC and the regional indices additionally use cosine-latitude weighting, while the observed field RMSE is valid-cell pooled but not latitude weighted (a recorded estimator boundary, §12).
Let $\hat y(w,\ell,x)$ and $y(w,\ell,x)$ denote predicted and observed anomalies, $V$ the set of valid cells, and $W$, $L$ the window and lead index sets.
D1— pooled and leadwise field RMSE.- \[ \mathrm{RMSE} \;=\; \Bigl( \tfrac{1}{|W||L||V|} \textstyle\sum_{w,\ell,x\in V} \bigl(\hat y - y\bigr)^2 \Bigr)^{1/2}, \qquad \mathrm{RMSE}(\ell) \;=\; \Bigl( \tfrac{1}{|W||V|} \textstyle\sum_{w,x\in V} \bigl(\hat y - y\bigr)^2 \Bigr)^{1/2}. \](2)
D2— baseline comparison.- Absolute RMSE for persistence and zero anomaly; the paired per-window delta $\Delta_w = \mathrm{RMSE}_w^{\mathrm{model}} - \mathrm{RMSE}_w^{\mathrm{base}}$ with its bootstrap interval (§11); the number of windows beating persistence; and the number of leads beating each baseline.
D3— field anomaly correlation coefficient.The pooled space–time ACC at lead $\ell$ uses cosine weights $c_x=\cos\varphi_x$ and weighted centering over all windows and valid cells,
\[ \mathrm{ACC}(\ell) \;=\; \frac{\sum_{w,x} c_x\,(\hat y-\overline{\hat y})(y-\overline{y})} {\sqrt{\sum_{w,x} c_x (\hat y-\overline{\hat y})^2}\, \sqrt{\sum_{w,x} c_x (y-\overline{y})^2}}, \](3)reported by lead with its mean over leads. The legacy mean-window spatial ACC (the mean over windows of per-window spatial correlations) is a distinct statistic used by the bootstrap machinery and must be labeled
mean_window_field_accwherever it appears.D4— Niño-3.4 correlation.- At each lead $\ell$, the Pearson correlation across windows of predicted versus observed index values $\{\hat N(w,\ell)\}_w$ and $\{N(w,\ell)\}_w$, plus the mean over leads 3–14. Correlations undefined for constant forecasts (e.g. zero anomaly) remain undefined and are never zero-filled.
D5— Niño-3.4 RMSE.- Leadwise index RMSE and the declared pooled or lead-mean summary (leads 3–14 in the headline convention).
D6— amplitude ratios.Prediction-to-target standard-deviation ratios for the full field, the equatorial band ($5^{\circ}$S–$5^{\circ}$N, $120^{\circ}$E–$280^{\circ}$E), and Niño-3.4:
\[ R_\sigma \;=\; \sigma(\hat y) \,/\, \sigma(y). \](4)Values near one indicate amplitude fidelity; they are descriptive unless a gate was declared in advance, and larger is not automatically better.
6. Cross-Series Anchor Results
The following rows are carried unchanged, always with their evidence badge and estimator scope, as orientation anchors. They are generation-1 values in the fixed-1981–2010-reference frame; the publication's numbers live in the relative-SST frame on different windows and must never be ranked against them.
| Quantity | Badge | PB-1 | G2-long | Baselines |
|---|---|---|---|---|
| Field RMSE, 2016–2020 (${}^{\circ}\mathrm{C}$) | E4a / E4b | 0.5406 | 0.5390 | pers. 0.6591; zero 0.6200 |
| Field ACC, 2016–2020 | E4a / E4b | $+$0.2553 | $+$0.2229 | pers. $+$0.2292 |
| Niño-3.4 corr. 3–14, 2016–2020 | E4a / E4b | $+$0.3432 | $+$0.3532 | pers. $-$0.015 |
| Niño-3.4 RMSE 3–14, 2016–2020 (${}^{\circ}\mathrm{C}$) | E4a / E4b | 0.5714 | 0.6912 | zero 0.5821; pers. 0.7774 |
| Variability ratios (full/eq/Niño-3.4) | E4a | 0.408 / 0.398 / 0.411 (amplitude damped) | ||
| Niño-3.4 RMSE, validation (${}^{\circ}\mathrm{C}$) | E3 | 0.5256 | 0.4748 | (learned-center G2-long mean) |
| Raw fair CRPS, validation | E3 | — | 0.2396 | canonical audit; archived 0.2405 |
| Calibrated CRPS / P2 / P3 | E3 | — | 0.2463 / 0.958 / 59–77–82% | flat LOYO, learned center |
| Raw / calib. P2, test | E4b | — | 0.263 / 0.641 | validation-fit $\sigma$ |
| Raw / calib. P3, test (%) | E4b | — | 20–38–45 / 43–61–68 | nominal 50–80–90 |
| Raw / calib. fair CRPS, test | E4b | — | 0.4369 / 0.3890 | canonical; archived 0.4450/0.4107 |
P1. The rows demonstrate that the validation advantages of G2-long did not fully transfer to the test period.PB-1's paired sealed-test delta against persistence is $-0.1185\,{}^{\circ}\mathrm{C}$ with 90% CI $[-0.1561,-0.0858]$, with $35/35$ windows beating persistence and $14/14$ leads beating zero anomaly. G2-long's E4b headline (ensemble-mean minus persistence Niño-3.4 RMSE) is $-0.086$ with 90% CI $[-0.432,+0.090]$: unresolved.
7. Persistent Probabilistic Extension (P1–P6)
Introduced in Report 6 and carried unchanged through Reports 7–8 and the publication. The deterministic scorecard D1–D6 is always reported alongside, for the ensemble mean (and, where distinct, the frozen mean head).
P1— fair ensemble CRPS.For an $M$-member ensemble $\{q_m\}_{m=1}^{M}$ and verification $y$, the fair (unbiased small-ensemble) estimator equation CRPS_fair = 1M_m=1^M q_m - y - 12M(M-1)_m=1^M_m' m q_m - q_m' .
equation The canonical index estimator scores each $[\mathrm{window},\mathrm{lead}]$ case over its member axis before averaging over cases (leads 3–14 in the headline scope). Estimator version and ensemble size are recorded with every value, because (i) early legacy artifacts used the finite-ensemble empirical form with denominator $M^2$ in the second term, and (ii) the archived Phase F/G projection scorer reshaped $[\mathrm{window},\mathrm{member},\mathrm{lead}]$ arrays without first moving the member axis last, mixing lead and member axes (§12).
P2— spread–skill ratio.Pooled ensemble standard deviation divided by the RMSE of the ensemble mean,
\[ \mathrm{SSR} \;=\; \Bigl(\tfrac{1}{|C|}\textstyle\sum_{c\in C} s_c^2\Bigr)^{1/2} \Big/\; \Bigl(\tfrac{1}{|C|}\textstyle\sum_{c\in C} (\bar q_c - y_c)^2\Bigr)^{1/2}, \](5)over cases $c$ (window, lead pairs in the declared scope), for Niño-3.4 and the field. The working calibration band is $[0.8, 1.2]$ where predeclared.
P3— interval coverage.- Empirical coverage of equal-tailed 50%, 80%, and 90% central intervals and mean interval width; coverage error is reported in percentage points, not only pass/fail.
P4a— canonical member sharpness (PE style).- Per member and window, the population standard-deviation ratio of predicted to observed values over all 14 leads, pooled by the declared median, for full field, equatorial band, and Niño-3.4. Sharpness is a member property; it is distinct from ensemble spread (
P2) and from ensemble-mean amplitude (D6). P4b— field-lifting integrity ratio.- Full-field unbiased standard-deviation ratio over leads 3–14, averaged over members within each window and summarized by the median window. The reported final value 0.800 uses this estimator; it must not be ranked against
P4awithout canonical recomputation. P5a— generative-head spectral ratio.- Normalized packed-coefficient RMS of members divided by truth, for the lowpass band and highpass levels 1–3.
P5b— lifting spectral-integrity change.- Before/after percentage change in physical-space band-limited reconstructed-field RMS under lifting. This measures preservation under a post-processing map, not member-to-truth spectral fidelity, and is not interchangeable with
P5a. P6— distributional diagnostics.- Rank histogram, threshold probabilities, Brier scores where defined, and explicitly labeled event case studies (e.g. 2015). Case studies never select checkpoints.
8. Persistent Trajectory Extension (T1–T5)
Introduced in Report 8 for member Niño-3.4 trajectories $q_m(w,\cdot)\in\mathbb{R}^{14}$ against observed trajectories $y(w,\cdot)$; these metrics separate visually smooth paths from learned multivariate trajectory structure.
T1— temporal-difference ratio (TDR).- \[ \mathrm{TDR} \;=\; \frac{\bigl\langle\, \lvert q_m(w,\ell) - q_m(w,\ell-1)\rvert \,\bigr\rangle_{m,w,\ell}} {\bigl\langle\, \lvert y(w,\ell) - y(w,\ell-1)\rvert \,\bigr\rangle_{w,\ell}}, \qquad \text{target band } [0.8, 1.2]. \](6)
T2— increment autocorrelation.- Lag-1 (and lag-2, reported) autocorrelation of monthly increments $\delta_\ell = q(\ell)-q(\ell-1)$ per trajectory, averaged, with the observed reference ($+0.161$ lag-1 on validation). The principal gate uses the absolute distance from the observed lag-1 value.
T3— trajectory variogram and energy scores.Per window,
\[ \mathrm{VS}_p \;=\; \sum_{i<j} w_{ij} \Bigl( \lvert y_i - y_j\rvert^{p} - \tfrac{1}{M}\textstyle\sum_m \lvert q_{m,i}-q_{m,j}\rvert^{p} \Bigr)^{2}, \qquad p=\tfrac12,\;\; w_{ij}=\lvert i-j\rvert^{-1}, \](7)averaged over windows (lower is better), plus the fair 14-dimensional trajectory energy score $\mathrm{ES} = \langle\lVert q_m - y\rVert\rangle_m - \frac{1}{2M(M-1)}\sum_{m\neq m'}\lVert q_m - q_{m'}\rVert$.
T4— high-frequency fraction.- The fraction of increment-spectrum power in the top half of temporal frequencies, member and observed values.
T5a— canonical flow dependence.- The across-window correlation between the absolute error of the ensemble center actually used by the product and the ensemble spread, with lead scope and pooling fixed in the metric name.
T5b— frozen-reference diagnostic.- The historical variant: correlation between absolute PB-1 mean-head error and ensemble spread. Phase G's reported $+0.152$ used this quantity on a separately seeded artifact; it is not
T5afor the learned-center adopted product (whose canonical raw value is $+0.354$, becoming $-0.492$ after flat calibration).
9. Persistent Transport Extension (TR1–TR2)
Introduced whenever one frozen product is evaluated on both development validation and a later time split. These describe transport of performance, not an additional model-selection criterion, and require identical metric scope on both sides.
TR1— baseline-relative skill contrast.With a declared sign convention in which positive favors the candidate, compute the candidate-minus-reference advantage $A_{\mathrm{val}}$ and $A_{\mathrm{test}}$ on each split, and report
\[ \mathrm{TR1} \;=\; A_{\mathrm{test}} - A_{\mathrm{val}}. \](8)For G2-long Niño-3.4 RMSE relative to PB-1 the advantage moves from $+0.0508\,{}^{\circ}\mathrm{C}$ (validation) to $-0.1198\,{}^{\circ}\mathrm{C}$ (test), i.e. $\mathrm{TR1} = -0.1706\,{}^{\circ}\mathrm{C}$.
TR2— within-split calibration effect.- Calibrated-minus-raw canonical
P1, the distance ofP2from one, and absoluteP3coverage error, on each split. Validation values are labeled LOYO; E4b values are labeled fit-on-all-validation / apply-unchanged-to-test. The two fitting modes are never interpreted as an unqualified ranking.
10. Phase-Specific Diagnostic Modules (X1–X4)
Mechanistic metrics keep stable module names so recurring diagnostics are recognizable without contaminating the forecast scorecard.
X1- Masked normalized coefficient MSE, split by store, temporal mask type, and wavelet group.
X2- Inverse-normalized reconstruction RMSE for the field, equatorial band, and Niño-3.4, plus tendency diagnostics where used.
X3- Persistence-cancellation module: residual/persistence cosine and correlation, opposing-energy share, required-versus-excess cancellation (the target-aware excess $\max(0,\beta^-_{\mathrm{pred}} - \beta^-_{\mathrm{tgt}} - \tau)$ for negative persistence projections $\beta^-$ and margin $\tau$), and decomposition closure.
X4- Provenance: parameter count, trained/frozen tensor counts, training steps, runtime, source/window counts, config path, checkpoint SHA-256, and exact-resume status.
11. Uncertainty, Resampling, and Decision Language
House bootstrap. Paired observed-family comparisons use the same ordered validation (or test) windows in both runs, a moving-block bootstrap with blocks of six consecutive windows, 10,000 resamples, 90% percentile intervals, and fixed seed 20260703. Each metric is recomputed from the resampled window collection; aggregate summaries are never expanded into synthetic samples. Reports state the point delta, the interval, the preferred direction, the predeclared practical minimum effect, and the decision branch taken. A confidence interval that crosses zero is reported as unresolved — never as a win or a loss, regardless of the point estimate.
Calibration fitting modes. Calibration selection and all calibrated performance reported on E3-VAL use leave-one-context-start-year-out folds (2011/2012/2013). Once a calibration method is frozen, an E4b deployment fit may use all validation windows and must be applied to test unchanged, with no test refitting. CMIP-based selection must identify held-out source models and aggregate so that no source with more windows dominates silently. All Phase E–G work must disclose that consultation budgets were waived on 7 July 2026 and that validation was adaptively reused thereafter.
Executed and remaining sensitivity additions. The publication's revision pass executed two of the planned additions on its final-generation products: block-length sensitivity (blocks of 3–14 windows, with resolved/unresolved labels stable across the sweep) and sampling-seed replication for ensemble metrics (ten predeclared seed replications plus a pooled-member analysis). Model-level or hierarchical uncertainty for CMIP aggregates remains open. These additions complement, and do not retroactively change, the recorded house bootstrap.
12. Comparability and Versioning Rules
Metric definitions may be versioned but never silently redefined under an existing identifier. The following known estimator boundaries require a broken table line or an explicit footnote wherever they are crossed.
- Three ACCs. Observed aggregate field ACC is the mean over leads of pooled space–time ACC; bootstrap comparisons use the mean of stored per-window spatial ACC; held-out-CMIP ACC is a third, per-window mean-lead statistic. They never share an unlabeled column.
- Two Niño-3.4 correlation aggregations. Observed
D4averages separate cross-window correlations over leads 3–14; the CMIP selector flattens windows and those leads into one correlation. - CRPS estimator versions. The legacy probabilistic evaluator uses the finite-ensemble $M^2$ empirical CRPS and usually all 14 leads; Phase F/G headlines use fair $M(M-1)$ CRPS over leads 3–14. Values are recomputed under one convention before any ranking across the boundary.
- The lead/member axis defect. The archived Phase F/G projection scorer reshaped $[\mathrm{window},\mathrm{member},\mathrm{lead}]$ without moving the member axis last, so its CRPS rows mix lead and member axes. Archived values are retained only as historical gate records; canonical
P1is recomputed per window/lead. For G2-long the corrected validation pair is $0.2396/0.2463$ (raw/calibrated) and the corrected E4b pair is $0.4369/0.3890$; the qualitative gate directions are unchanged in both cases. - Spread–skill scopes. Legacy and Phase F/G ratios differ in lead scope and in whether leadwise RMSE is averaged before division or pooled first.
- Weighting. Observed field RMSE is valid-cell pooled but not latitude weighted; ACC and regional indices use cosine-latitude weights.
- CMIP normalization. CMIP scores use realization-local detrending, climatologies, and normalization; they are not absolute counterparts of ERA5 scores.
- Ensemble identity. Raw versus calibrated ensembles, member counts and seeds, and PB-1–centered versus learned-ensemble-mean–centered calibration require explicit identities in every table.
- Index versus ONI. The monthly Niño-3.4 box mean is not the official three-month ONI event definition. Threshold probabilities are therefore not operational event probabilities, and the repository does not yet compute the Brier scores mentioned in planning documents.
- Tier separation.
E3-VAL,E4a-TEST, andE4b-TESTevidence never appear in one undifferentiated ranking. PB-1's artifact provides a paired CI for field RMSE versus persistence; G2-long's posthoc artifact provides its declared Niño-3.4-index comparison; other intervals require documented recomputation from preserved per-window records. - Stale metadata. The final-test summary retains stale diagnostic wording, and its YAML target-mode field does not match the executed checkpoint's persistence-residual contract; the G2-long probabilistic summary retains a stale “validation-only” status string despite
split=test. Evidentiary status is established from the frozen checkpoint hash, the evaluator command/split, the materialization record, andtest_data_readtogether — never from any single generated prose field. - E4b scope. E4b covers the raw G2-long ensemble and center plus validation-fit index calibration only; F1b lifted fields and
T1–T5were not tested. Recomputations from frozen test records after the declared read are audit-only and cannot strengthen the evidentiary tier.
13. Minimum Table and Figure Package
Each scientific report contains at least: (1) a study-design and gate table; (2) the applicable persistent scorecard with evidence labels; (3) an ablation table with one row per decision-relevant run; (4) a provenance (X4) table; and (5) at least one leadwise or trajectory figure. The series uses fixed color identities — one each for the current report's candidate model, persistence, zero anomaly, PB-1, and the adopted G2-long stack — in every figure. For probabilistic comparisons, one canonical member artifact and seed is designated per table, and evaluator-seed/Monte-Carlo sensitivity is added rather than quietly combining evaluator and script outputs.
14. Source-of-Truth Order
When records disagree, they are consulted in this order: (1) the append-only validation ledger, for final decisions and results; (2) the frozen PB-1 protocol (docs/final_protocol.md) and the G2-long amendment (docs/final_protocol_amendment_g2long_sealed_test.md), for their respective test authorizations; (3) phase plans and the experiment log, for rationale and chronology; (4) machine-readable artifacts and code, for metric definitions; (5) configs and checkpoint reports, for provenance. README and checklist files are orientation only. The latest ledger test entry supersedes earlier Phase G prose stating that G2-long was “not adopted” or “never tested.”