Causal Observational References for Tropical-Pacific SST Forecasting
Scientific Report 9: Phase J, Relative-SST Selection, and the Live-Test Handoff
Abstract
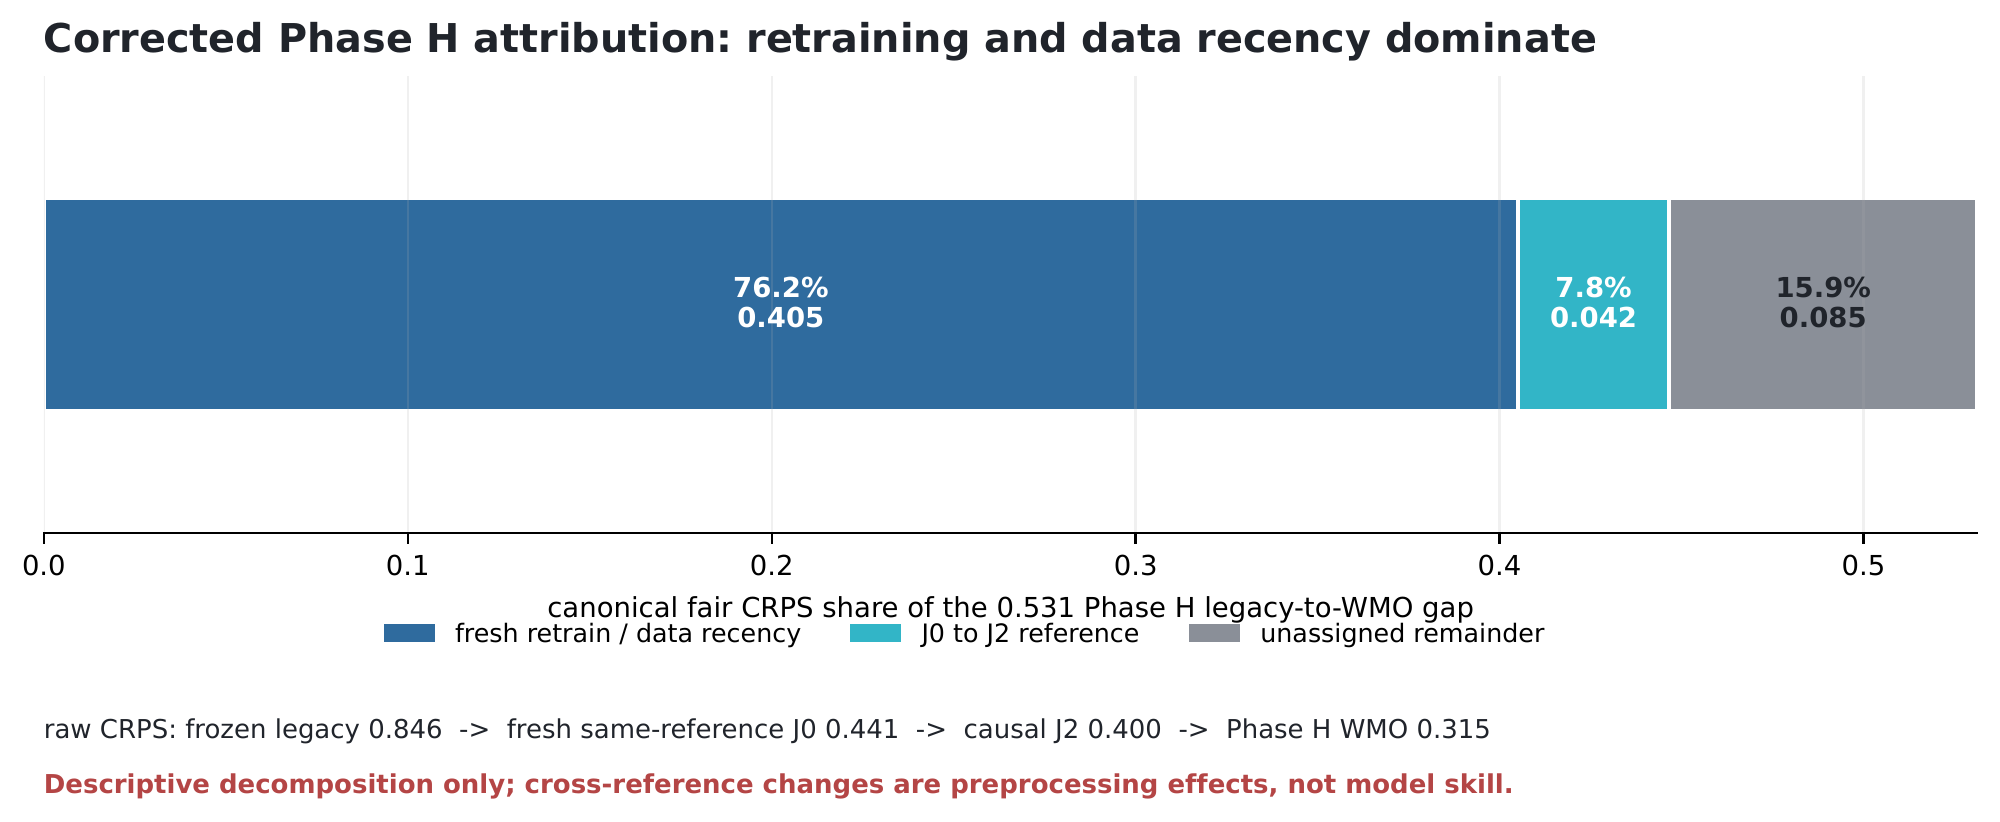
Phase H showed that the project's fixed 1981–2010 SST-anomaly reference had become stale, but its apparent WMO-climatology “winner” mixed a new reference, a new model generation and a longer training record. Phase J is the missing preprocessing-and-retrain control. Five strictly separate ERA5 pipelines change only the anomaly reduction: J0 fixed 1981–2010; J1 fixed 1991–2020; J2 a causal 30-year trailing climatology updated in five-year blocks; J3 relative SST over J2; and J4 a training-fit cellwise linear detrend. The identical PB-live deterministic and G2-live probabilistic recipes are freshly trained under each reference, with reference-local coefficient normalization and an enforced require_matched_reference guard. Selection uses reused, non-pristine 2016–2020 E3'-VAL. J3 is selected: in relative space, PB-live field RMSE is $0.56328\,{}^{\circ}\mathrm{C}$ and Niño-3.4 correlation $0.43042$; G2-live raw/flat fair CRPS is $0.63274/0.50793$. Under a frozen, oracle-free reconstruction that persists the cosine-weighted J2 tropical-mean anomaly at context end across all 14 leads, background-restored fair CRPS is $0.55167$ and event-Brier $0.27620$. The matched reconstructed J3-minus-J2 fair-CRPS delta is $-0.04762$, 90% CI $[-0.07401,-0.02448]$. J1 is excluded from causal deployment because its 1991–2020 base retrospectively includes the 2016–2020 forecast block; J4 is diagnostic because its $0.253\,{}^{\circ}\mathrm{C}$ extrapolated correction is 2.07 times J2's. The matched control also corrects the Phase H attribution. On spent 2021–2025 data, frozen legacy raw CRPS $0.84621$ falls to $0.44120$ after fresh same-reference J0 retraining: $76.24\%$ of the $0.53121$ legacy-to-WMO gap. J0-to-J2 reference updating contributes only $0.04164$ ($7.84\%$). Those 2021–2025 values are audit-only, spent E5-TEST, reported-not-confirmatory. The operational lesson is regular retraining first, causal reference maintenance second. Phase J freezes J3 and its reconstruction assumption for Phase I; prospective 2026 E6-LIVE confirmation remains pending.
1. Study Identity and Handoff
Study ID: R9 / Phase J. Incoming state: Phase H's fresh 2021–2025 read, where fixed-reference generation-1 forecasts degraded and a 1991–2020 successor looked much better under an unmatched reference. Single factor family: observational anomaly reduction; architecture, loss, freeze boundary, warm-start checkpoints and within-variant coefficient standardization protocol remain fixed. Predeclared evidence: reused 2016–2020 E3'-VAL for selection; spent 2021–2025 E5-TEST only as audit, never as confirmation. Terminal decision: select J3 relative SST over causal J2, with background-restored reconstruction by context-end tropical-mean persistence. Handoff: Phase I freezes the 1996–2025 base for the 2026–2030 block, retrains PB-live and G2-live on all data through 2025, and waits for prospective E6-LIVE. Timeline: predeclaration, execution and handoff recorded 2026-07-13; test_data_read_2026=false throughout.
2. Introduction
An anomaly forecast is inseparable from its reference. If a fixed climatology ages while the tropical Pacific warms, the prediction target acquires a low-frequency offset that the training distribution did not contain. Phase H made this operationally visible: generation-1 models, retained under their 1981–2010 base, had 2021–2025 field RMSE near $0.83\,{}^{\circ}\mathrm{C}$ and Niño-3.4 correlation near $0.05$, while a successor trained and evaluated under a 1991–2020 base had much smaller errors. The draft interpretation called this a climatology-reference artifact. That statement was directionally plausible but scientifically incomplete: Phase H also changed the checkpoint generation, training endpoint and calibration window, and it never trained the same recipe under both references.
Phase J repairs that design. It asks which anomaly reference should underlie the actual deployment products, while never re-referencing a frozen model and never ranking a score across different truth definitions. Five variants span fixed, self-updating, relative-SST and linear-detrend approaches. Each receives its own anomaly maps, DTCWT coefficients, train-only normalizer, PB-live checkpoint and G2-live checkpoint. The result is both a product choice and a correction to the project's earlier causal story.
Three questions organize the report:
- Does a causal moving climatology repair event calibration relative to the fixed legacy control without future leakage?
- Does relative SST improve the deployable probabilistic product enough to justify an auxiliary tropical-mean reconstruction assumption?
- How much of the Phase H WMO gap is attributable to reference updating, and how much appears before the reference changes through fresh retraining and data recency?
3. Focused Literature Review
Moving and sliding climatological bases. Historical CPC ONI uses a three-month running Niño-3.4 anomaly with centered 30-year base periods updated every five years; in real-time use, the last completed 30-year base serves until the next update [1]. Updating reduces contamination of interannual ENSO categories by long-term warming. Centered bases are appropriate for retrospective classification but use future years relative to early portions of their target block. Forecast production therefore needs a trailing analogue: Phase J uses only the 30 complete years before each five-year block.
Relative SST and tropical-mean warming. The atmosphere responds to spatial SST contrast as well as absolute local temperature. Relative-SST indices subtract a tropical-mean anomaly from the Niño-3.4 region, giving ENSO categories that are less sensitive to changing climate and multidecadal variability [2]; relative SST also better organizes tropical convection and rainfall in several settings [3]. This physical advantage has a forecasting cost: the removed tropical mean must be predicted before a conventional ONI-style index can be reconstructed. Phase J treats that cost as part of the model contract rather than hiding it in post-processing.
Detrending ENSO. Linear detrending is common when isolating interannual variability, and the project's CMIP realizations are detrended before their climatologies are computed. Yet a line fit to 1981–2015 and extrapolated indefinitely is a strong structural assumption: internally generated decadal variation can be absorbed into the slope, while acceleration or pattern changes can make the extrapolation wrong. ENSO trends are particularly hard to identify in short records with large event-to-event variability [4]. J4 therefore measures preprocessing parity with CMIP but is not presumed deployable.
Domain-adaptation framing. CMIP forecast-task pretraining is the source-domain stage and observed fine-tuning is the target-domain stage, following the broader simulation-to-observation strategy used in deep ENSO and weather forecasting [5, 6]. If CMIP is detrended and observations retain an increasingly stale mean, the low-frequency interface itself is misaligned. J2–J4 are simple input-space domain-alignment tests, not a new learned domain-adaptation algorithm. The matched design is what permits a causal interpretation.
4. Data and the Anomaly-Reference Axis
ERA5 monthly SST [7] spans 1981-01–2025-12 on the common $24\times48$ tropical-Pacific grid ($30^{\circ}$S–$30^{\circ}$N, $120^{\circ}$E–$280^{\circ}$E). Every 26-month window contains 12 context and 14 target maps. Phase J stores contain 395 training windows (1981–2015), 35 reused validation windows (2016–2020) and 35 audit windows (2021–2025). Each coefficient normalizer uses training months only. Store audits found 540 source months and maximum DTCWT reconstruction error $1.91\times10^{-6}$ to $2.86\times10^{-6}$.
| Variant | Reduction | Causality / role | Terminal status |
|---|---|---|---|
| J0 | fixed 1981–2010 climatology | frozen legacy control | control only |
| J1 | fixed 1991–2020 climatology | retrospective on 2016–2020 | excluded from causal deployment |
| J2 | trailing 30-year base per five-year block | strictly backward-looking | primary causal baseline |
| J3 | J2 then remove monthly tropical-Pacific mean | causal; needs background restoration | selected |
| J4 | cellwise linear trend fit on 1981–2015 | causal extrapolation, structurally risky | diagnostic only |
J0 and J1 subtract fixed calendar-month climatologies. J2 recomputes the base for each five-year block from its preceding 30 years. J3 subtracts the monthly cosine-weighted domain mean after J2. J4 removes a cellwise linear trend fitted on training years, then subtracts its training-period monthly climatology. No frozen checkpoint or normalizer crosses rows.
5. Method
5.1 Causal Reductions
For five-year block start $b$, month $m$ and cell $x$, the J2 base and anomaly are
The implementation assigns context and target maps to the same block base and asserts that the base ends before the block. Early blocks lacking 20 years of history use the declared 1981–2010 warm-up base; that policy is stamped in the reference key.
With domain $\Omega$ and latitude $\varphi_x$, J3 is
Primary field and index scores use $a^{\mathrm{J3}}$. The frozen background-restored reconstruction is
Thus all 14 leads share the context-end J2 domain-mean anomaly. This is oracle-free and causal, but it is a persistence model for the omitted background component. Every ONI-style index, CRPS, reliability, and Brier value is conditional on Eq. (3). A naming note: Phase-J artifacts label this product “absolute-reference”; following the publication we call it background-restored, because it restores the removed tropical-mean departure but never the local climatology — it estimates the conventional climatological anomaly, not absolute SST.
J4 fits $S_t(x)=\alpha_{m(t)}(x)+\beta(x)t+\epsilon_t(x)$ on 1981–2015 only, subtracts $\widehat\beta(x)t$, then forms fixed monthly anomalies. Its trend is never refit on validation or audit months.
5.2 Matched-Reference Guard
Every reduced store carries a canonical anomaly_reference_key. Before model ranking, bootstrap, calibration comparison or selection, require_matched_reference extracts all keys and raises MismatchedAnomalyReferenceError if more than one is present. Phase J deliberately executed and caught this error for a direct five-variant ranking. Consequently:
Two metrics may be compared as skill only when their reference keys are identical. A difference between J0–J4 rows is a preprocessing effect, never a skill ranking.
5.3 Forecast Recipes and Gates
PB-live uses the v3 CMIP backbone, the Phase A features-only zero_output/decoder_last_block transfer and a guarded best-skill checkpoint. G2-live uses the immutable G2-long CMIP head, equal-band joint-sequence diffusion, $\eta=1$, $\rho=0$, 32 members, flat LOYO EMOS/ECC-Q and F1b coherent lowpass lifting. All observed checkpoints are freshly trained inside their reference.
The predeclaration required store causality/roundtrip checks; within-reference D1–D6; canonical fair CRPS; flat LOYO spread–skill and coverage; ONI/Brier/reliability; and F1b mean/index/spectral-integrity gates. J2 was favored unless resolvably worse. J3 could displace it only through a large enough gain in the shared background-restored reference to pay for reconstruction. J4 remained diagnostic absent a compelling gain large enough to justify extrapolation. Paired intervals use blocks of six ordered windows, 10,000 resamples, 90% percentiles and seed 20260703.
6. Results
6.1 Per-Variant Retrains on Reused E3'-VAL
Figure 1 and Table 2 display reference-local scores. They are intentionally not sorted by value. The apparent numerical advantages of one row over another include changed targets and baselines and are therefore preprocessing effects.
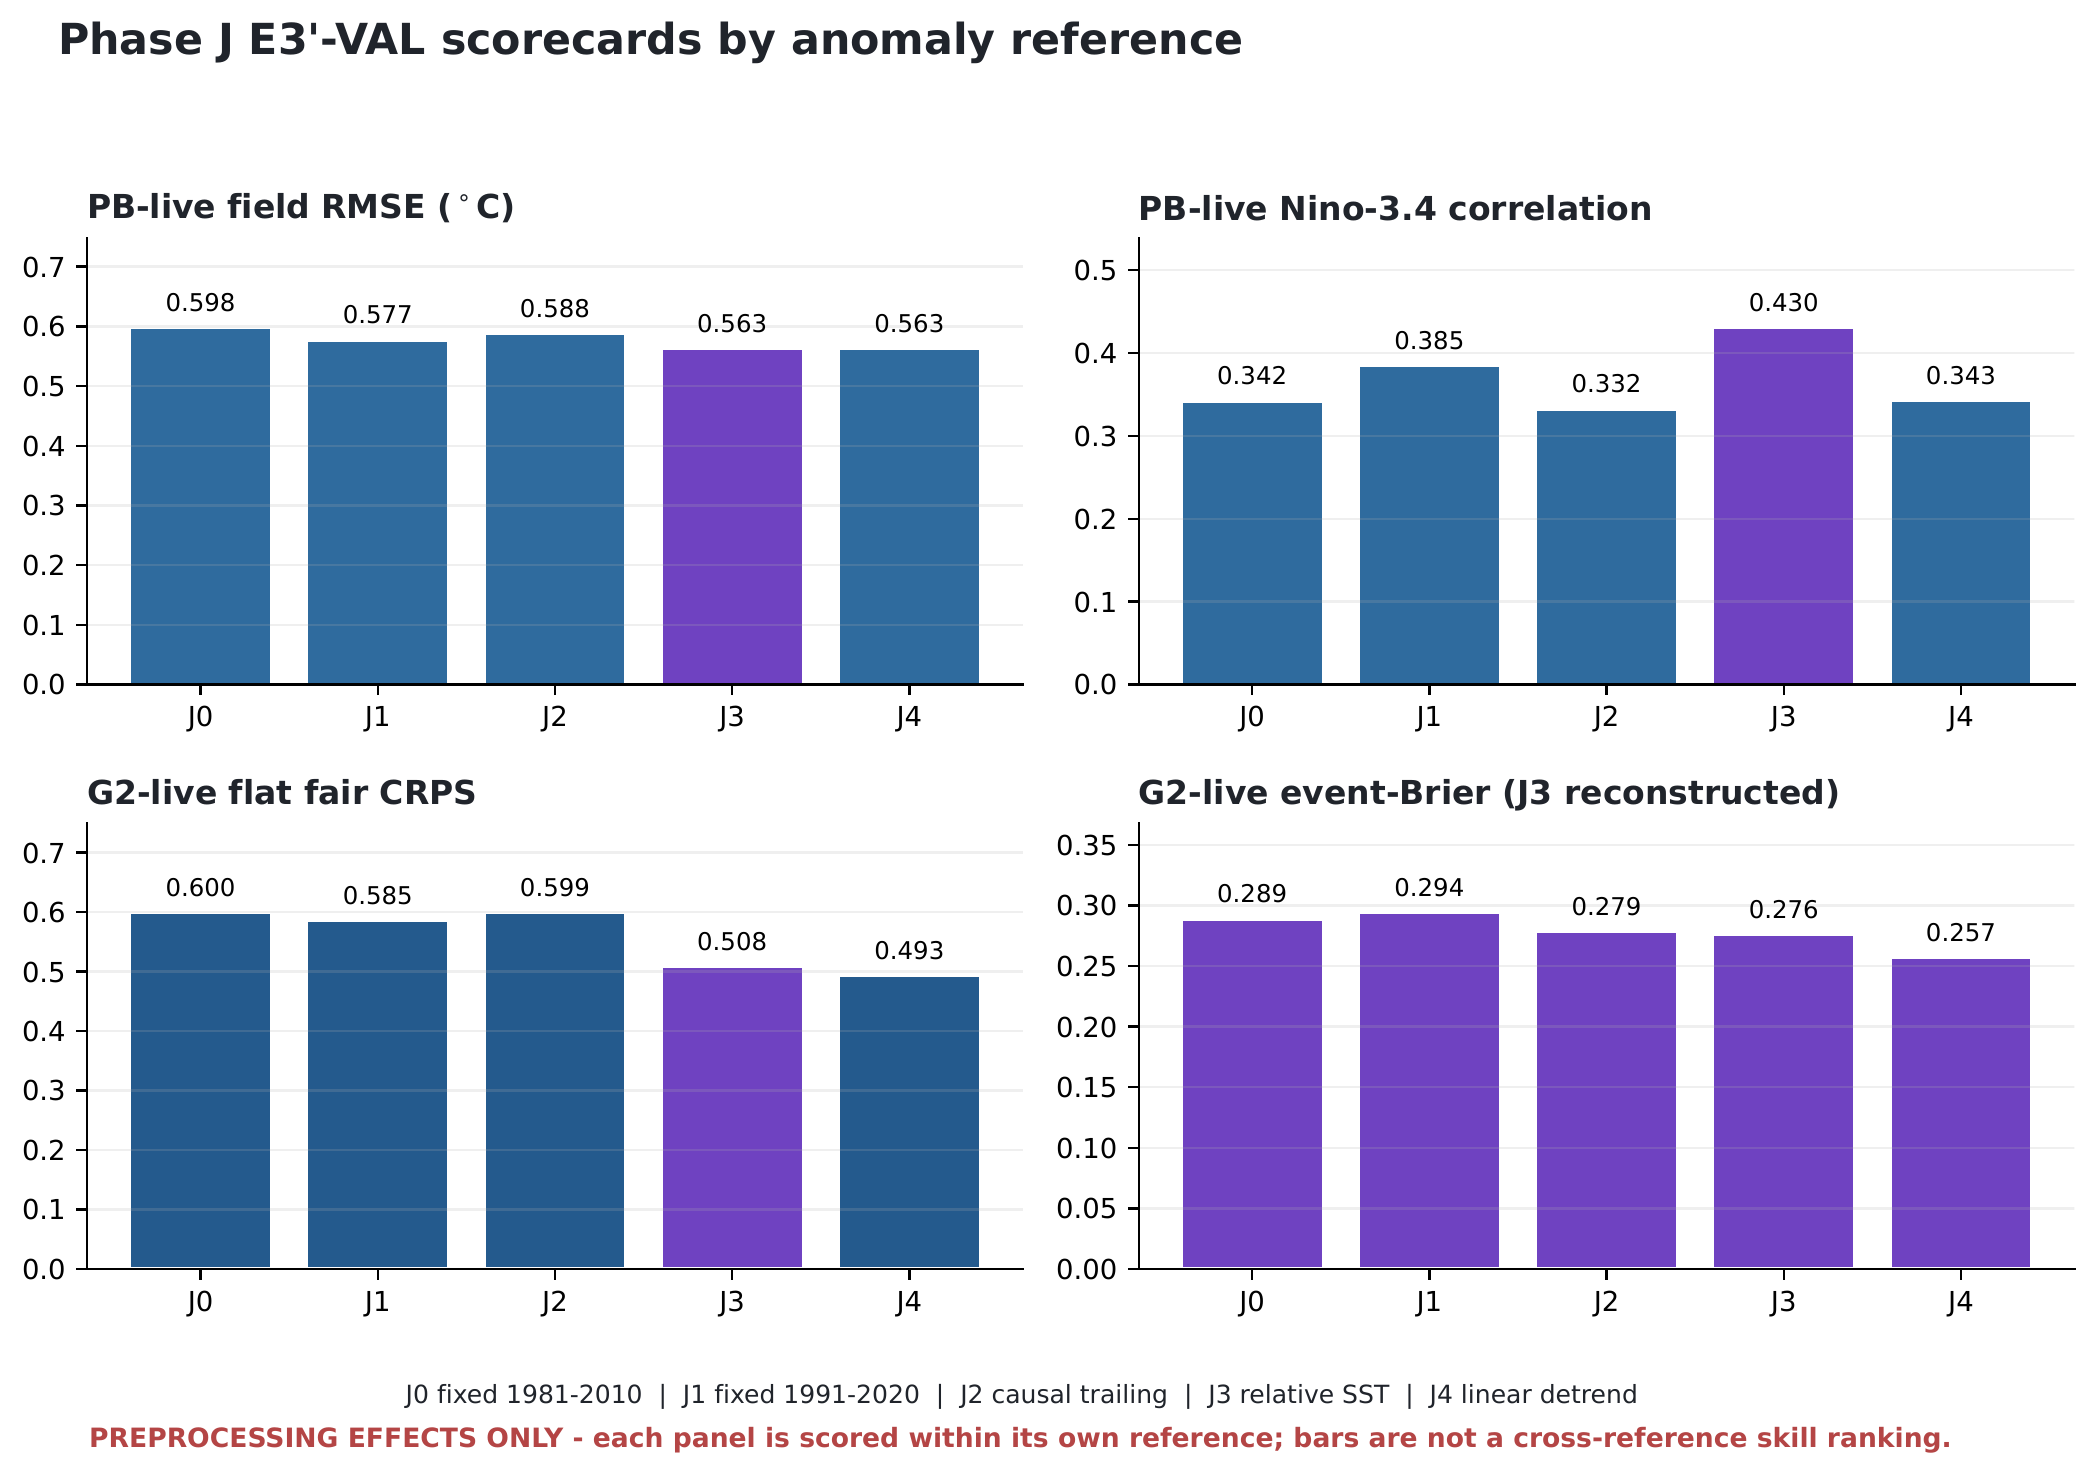
E3'-VAL). Bars are evaluated within separate references. The warning is part of the result: this is not a cross-reference skill ranking. The J3 Brier bar is background-restored under Eq. (3); the other J3 panels are relative-space.| PB field | PB Niño-3.4 | G2 fair CRPS | event | ||
|---|---|---|---|---|---|
| Variant | RMSE | corr. 3–14 | raw | flat LOYO | Brier |
| J0 | 0.59758 | 0.34189 | 0.75648 | 0.59976 | 0.28881 |
| J1 | 0.57680 | 0.38487 | 0.73622 | 0.58519 | 0.29440 |
| J2 | 0.58758 | 0.33218 | 0.75077 | 0.59928 | 0.27860 |
| J3 relative$^{\ast}$ | 0.56328 | 0.43042 | 0.63274 | 0.50793 | 0.27620$^{\dagger}$ |
| J4 diagnostic | 0.56278 | 0.34293 | 0.57080 | 0.49277 | 0.25719 |
All five within-reference PB-versus-G2 comparisons passed the guard. PB had resolvably lower Niño-3.4 RMSE than the sampled G2 center in every row; the PB minus G2 deltas were $-0.44258$, $-0.45959$, $-0.44224$, $-0.38424$ and $-0.32276\,{}^{\circ}\mathrm{C}$ for J0–J4, respectively, with all 90% intervals below zero. G2 remains valuable for calibrated distributional output rather than a better deterministic center. Every F1b run passed three of four gates: index fidelity, mean invariance (maximum shift $4.77\times10^{-7}\,{}^{\circ}\mathrm{C}$) and highpass integrity passed; full-field member standard deviation changed by more than 0.05.
6.2 Matched J0/J1/J2 Control and the Corrected Attribution
The matched control supports a modest stale-reference effect, not the earlier claim that the reference explained most of Phase H. J2 improves the predeclared validation event-Brier composite from J0's $0.28881$ to $0.27860$, so the stale- baseline falsification does not trigger. On real ERA5 audit maps, the J0 2021–2025 cosine-weighted field offset is $+0.340\,{}^{\circ}\mathrm{C}$; J2 reduces it to $+0.218\,{}^{\circ}\mathrm{C}$, a $0.122\,{}^{\circ}\mathrm{C}$ correction. The Niño-3.4 box offset change is smaller and cannot alone explain Phase H's large index gap.
The decisive decomposition uses the spent-period same-recipe runs. Frozen generation-1 legacy raw CRPS $0.846207$ falls to fresh same-reference J0 $0.441201$, a $0.405006$ recovery. Relative to the full legacy-to-WMO gap $0.531208$, that is $76.24\%$. Fresh J0-to-J2 contributes $0.041638$ or $7.84\%$; J0-to-J1 contributes $0.006976$ or $1.31\%$. The residual $15.92\%$ is not identified as model skill.
6.3 J3 Selection
J3 is evaluated primarily in relative space. Its selected PB-live checkpoint has field RMSE $0.563275\,{}^{\circ}\mathrm{C}$ and Niño-3.4 correlation $0.430422$; G2-live raw/flat canonical fair CRPS is $0.632737/0.507931$. To compare J3 with J2, both products are placed in the same J2 conventional-anomaly reference using the background-restored reconstruction of Eq. (3); the guard then passes. Reconstructed J3 fair CRPS is $0.551666$ versus J2 flat $0.599283$. The paired J3-minus-J2 delta is $-0.047618$, 90% CI $[-0.074013,-0.024481]$: resolvable. Reconstructed J3 event-Brier is $0.276204$. This gain is large enough under the predeclared rule to accept the auxiliary tropical-mean persistence assumption, so J3 is selected over the favored J2 default.
6.4 J1 Exclusion and J4 Diagnostic Status
J1's fixed base includes observations through 2020. It is useful for a retrospective matched preprocessing control, but for forecasts originating in 2016–2020 it is non-causal: future years within the verification block enter the base. It cannot be the deployment reference.
J4 has attractive own-reference values, including raw/flat CRPS $0.57080/0.49277$ and event-Brier $0.25719$, but these cannot be ranked against J2/J3. Its training-fit trend applies a $0.253\,{}^{\circ}\mathrm{C}$ 2021–2025 correction, 2.07 times J2's $0.122\,{}^{\circ}\mathrm{C}$ causal-reference correction. Because linear extrapolation was predeclared diagnostic and the correction is larger, J4 is not deployed.
6.5 2021–2025 Recomputations: Audit-Only, Spent E5-TEST
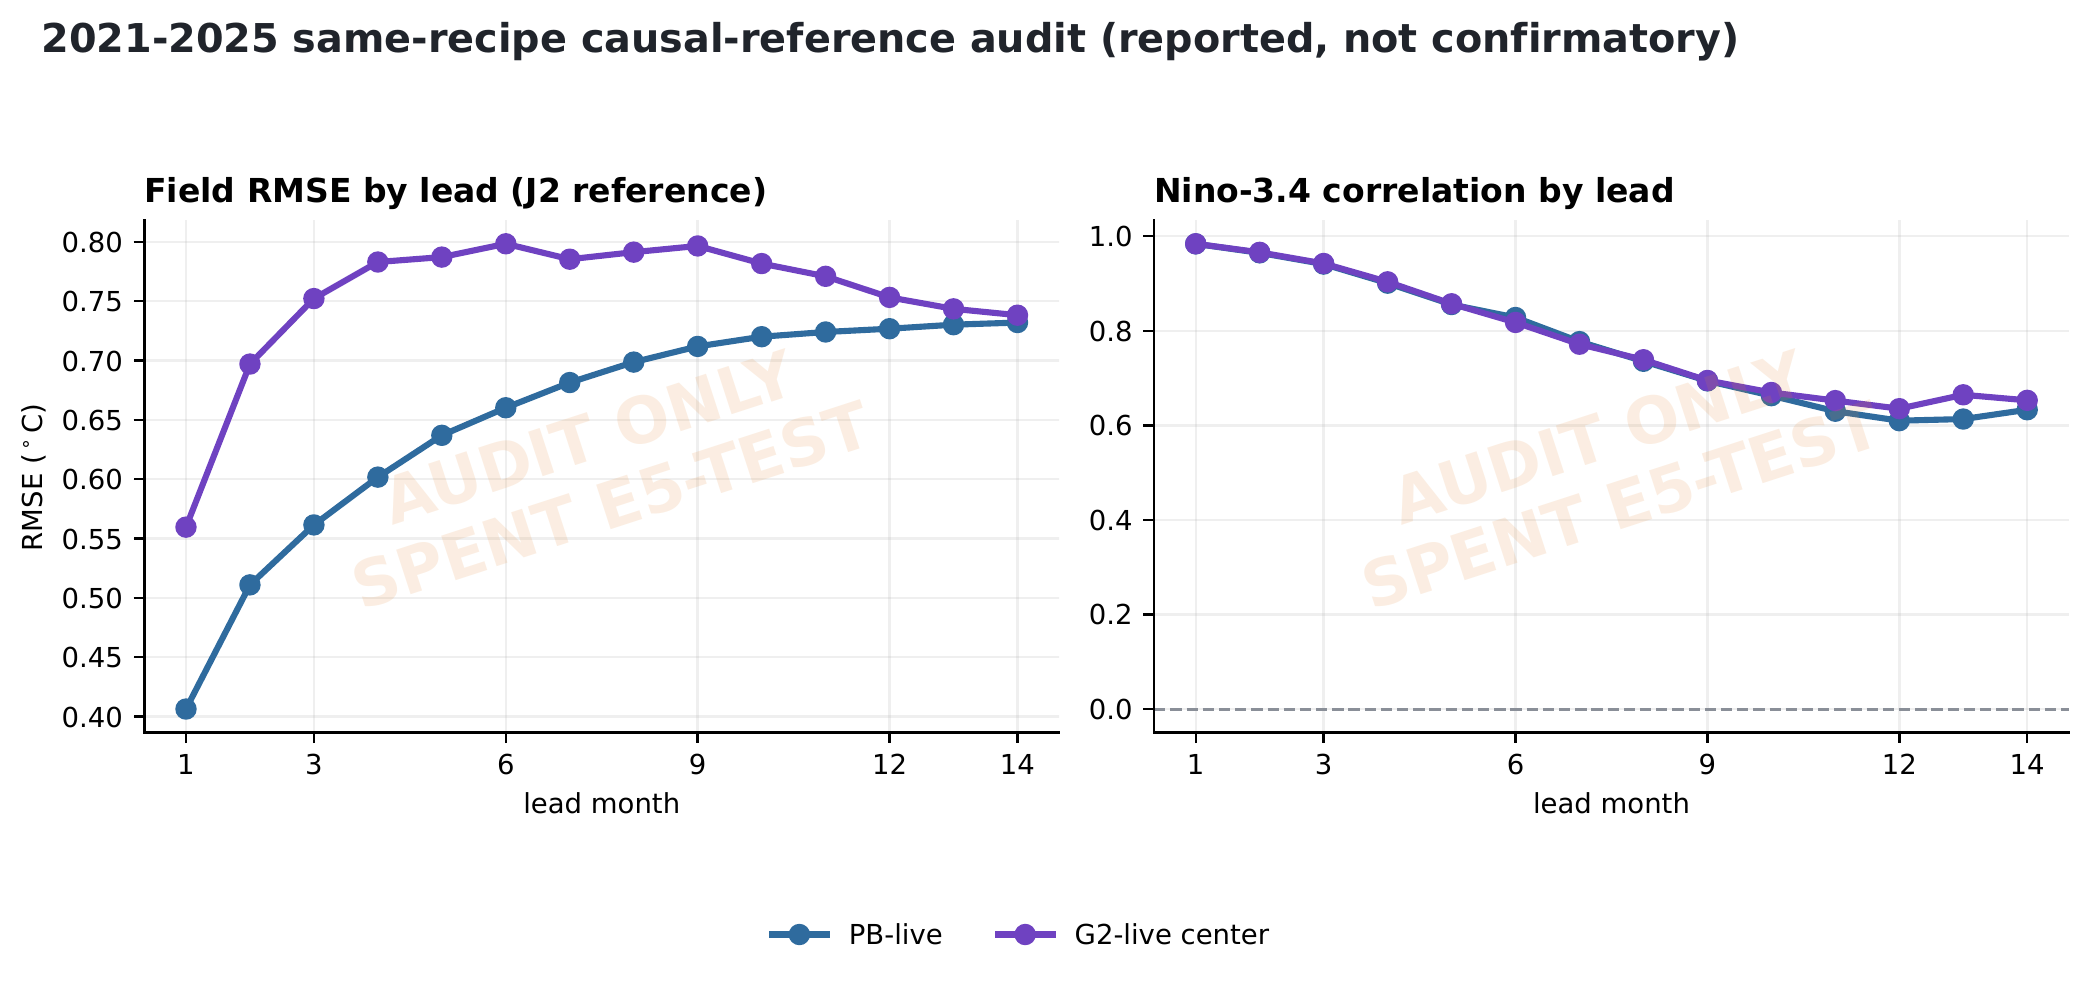
Exactly six authorized single-checkpoint reads evaluated J0/J1/J2 PB-live and G2-live, with zero reruns. Table 3 is stamped AUDIT-ONLY, SPENT E5-TEST, REPORTED-NOT-CONFIRMATORY. The period had already selected/informed Phase H recipes, so Phase J inherits an information path even though the checkpoints were freshly trained. No audit number selected J3 or strengthened an evidence tier.
| G2 fair CRPS | flat ONI | event | flat coverage | ||
|---|---|---|---|---|---|
| Variant | raw | flat | RMSE | Brier | 50/80/90% |
| J0 | 0.44120 | 0.41000 | 0.74719 | 0.17640 | 67.6/86.3/93.9 |
| J1 | 0.43422 | 0.40095 | 0.72741 | 0.17615 | 65.9/86.1/93.5 |
| J2 | 0.39956 | 0.38577 | 0.68995 | 0.16789 | 70.0/88.4/96.1 |
Under causal J2, PB/G2 field RMSE is $0.65713/0.75520\,{}^{\circ}\mathrm{C}$, Niño-3.4 correlation $0.74008/0.75005$, and G2 full/equatorial/Niño-3.4 amplitude ratios $0.83319/0.79292/0.78739$ (PB: $0.80718/0.76350/0.77452$). The G2 background-restored ONI-style correlation is $0.79656$. These are the basis for describing the retrained recipe family as strong on the spent period, not for claiming a selected-J3 test result.
7. Persistent Series Scorecard
The Phase J scorecard retains the charter identifiers within each reference. For point forecasts, D1 is pooled/leadwise field RMSE; D2 baseline deltas and paired uncertainty; D3 field ACC; D4 leadwise cross-window Niño-3.4 correlation; D5 Niño-3.4 RMSE; and D6 full/equatorial/Niño-3.4 amplitude ratios. The scorecard artifact contains every lead; Table 4 gives the common summaries.
D1 | D2 $\Delta$pers | D3 | D4 | D5 | D6 full/eq/Niño-3.4 | |
|---|---|---|---|---|---|---|
| J0 | 0.59758 | $-0.06156$ | 0.25330 | 0.34189 | 0.69567 | .807/.723/.744 |
| J1 | 0.57680 | $-0.06541$ | 0.20553 | 0.38487 | 0.64909 | .802/.712/.717 |
| J2 | 0.58758 | $-0.06946$ | 0.23316 | 0.33218 | 0.69132 | .801/.711/.712 |
| J3 | 0.56328 | $-0.07600$ | 0.23178 | 0.43042 | 0.58783 | .742/.687/.716 |
| J4 | 0.56278 | $-0.09524$ | 0.32192 | 0.34293 | 0.60530 | .775/.721/.695 |
E3'-VAL. RMSE units are ${}^{\circ}\mathrm{C}$; D2 is model-minus-persistence field RMSE; D3 is the recorded mean-window field ACC summary; D4/D5 use leads 3–14. Rows have different anomaly references and are not ranked.For ensembles, P1 is canonical fair CRPS; P2 spread–skill; P3 interval coverage; P4a member sharpness and the non-interchangeable P4b lifting-integrity ratio; P5a generative spectral fidelity and P5b lifting spectral change; and P6 rank/event/Brier diagnostics. Table 5 records the common Phase J summaries. P4/P5 are represented by the F1b gate result because the scorecard does not assign a cross-reference scalar ranking.
P1 CRPS | P2 | P3 | P4b/P5b | P6 | Reference | ||
|---|---|---|---|---|---|---|---|
| raw | flat | SSR | 50/80/90% | F1b gates | Brier | ||
| J0 | .75648 | .59976 | .9610 | 37.6/72.7/82.7 | 3/4 | .28881 | J0 |
| J1 | .73622 | .58519 | .9622 | 37.6/72.2/82.4 | 3/4 | .29440 | J1 |
| J2 | .75077 | .59928 | .9605 | 38.0/72.9/82.7 | 3/4 | .27860 | J2 |
| J3 | .63274 | .50793 | .9614 | 37.8/72.2/84.3 | 3/4 | .27620$^{\ast}$ | J3 / restored$^{\ast}$ |
| J4 | .57080 | .49277 | .9597 | 47.1/72.7/80.6 | 3/4 | .25719 | J4 |
E3'-VAL. $^{\ast}$J3 Brier is background-restored under Eq. (3); J3 CRPS and coverage columns are relative-space. Rows remain reference-local.7.1 X4 Provenance: Ten Reference-Local Checkpoints
All arms reuse v3 backbone SHA 2247c1f9…424462f4 and G2-long CMIP-head SHA e2dde94a… eedbba9e. The ten full guarded observed SHAs are:
J0 PB  070ac77792c5cbc9a26c76ca9cec7e6c1eb511557d1a7791a7189488f5bb9ca3
J0 G2  b3fd6b6bfa1e616c87ce5ef26a408a693da25e33e1dd2fbfe2e7d89a98a480d0
J1 PB  3715ca4c471073be5728cccd0e6700fb0f55694c0547a1c76ed1b130aaf35df7
J1 G2  11d84010b3598b60887ebda257e6f39955ee9cfc9ac2aef4556bde27963a662a
J2 PB  b1ca2315ddc9dbf6e20176dbfe61a33077b1e876dd378702a9052d5f78403c81
J2 G2  f965faa62afb3143302f149015cc8159988d593bb581ae073f2b2fa74a80db91
J3 PB  9c4046e313b8c1c96db4c0f5e4b3f81374e0564682524dd5bf694f1f13278973
J3 G2  2fa2755022f69d89246de7254c769d86f6a8d88f87e66a30d318681b2c39e95c
J4 PB  4251c6d2ea1c23e13ff96fc440e8740deeb889097ecb7553fc1dd79a82d629c2
J4 G2  94a1f88356565e811d11612723e0d58d27af359717de0475099ae113054cfdfa
Each has a reference-local normalizer, 395/35/35 store audit and immutable authorization record. The selected J3 pair is passed to Phase I as recipe provenance; full-record live SHAs remain pending.
8. Discussion
Retraining dominates climatology updating. The corrected decomposition changes the scientific headline. The stale climatology produces a real field-level distribution shift and modest event-calibration penalty, but the same-reference J0 retrain recovers most of the Phase H loss before any reference change. Regular training on the most recent permissible record is the first operational maintenance action; updating the causal base is the second.
Why J3 wins despite J2 being favored. J2 was the predeclared default because its conventional-anomaly reconstruction is exact: add back a known base. J3 removes an additional background component and therefore carries a forecasting obligation. The guarded $-0.04762$ CRPS difference is resolvable and large enough to accept that obligation. This is not a cross-reference ranking: the comparison is made only after reconstructing J3 into J2's conventional-anomaly reference.
Reconstruction is now part of the model. Persisting the context-end tropical mean is a clear baseline, not a physical guarantee. If the tropical mean changes systematically over the 14-month horizon, relative-space skill can coexist with poor ONI-style or Brier performance. Phase I must therefore report primary relative-space results and background-restored results as separate products, never allowing the latter's assumption to disappear into a caption footnote.
Reference alignment as transfer hygiene. Removing a stale common mode makes observed low-frequency statistics more consistent with detrended CMIP pretraining, but the experiment does not identify how much J3's gain comes from physical ENSO contrast versus improved source/target alignment. That mechanism would require controlled simulation preprocessing variants. The operational selection does not depend on resolving this secondary explanation.
9. Limitations
- Selection uses 2016–2020
E3'-VAL, a reused, non-pristine set of 35 overlapping windows. It cannot confirm the products. - The 2021–2025 audit is spent
E5-TEST. Phase H already read it, and the deployment recipe inherits that information path. All audit values are reported-not-confirmatory. - J3 background-restored ONI-style and Brier scores depend on context-end tropical-mean persistence for all 14 leads; no learned background-mean forecaster has been tested.
- All five F1b variants pass only three of four gates because intended lowpass inflation changes full-field member standard deviation by more than 0.05.
- J1 is retrospectively non-causal for 2016–2020, and J4's linear trend extrapolation may absorb internal variability or miss nonlinear warming.
- Cross-reference tables remain easy to misread even with warnings. The software guard prevents ranking, but readers must also respect the boundary.
- One 32-member realization per variant and the house six-window block length leave Monte-Carlo and serial-dependence sensitivity unresolved.
- The products use a coarse grid and limited baselines and are research outputs, not operational ENSO guidance.
10. Conclusion and Phase I Handoff
Phase J supplies the climatology-matched experiment Phase H lacked, selects the deployment anomaly contract and corrects the causal attribution. J3 relative SST over a causal J2 trailing base is adopted for PB-live and G2-live because its reconstructed J2-reference CRPS benefit is resolvable. The price is explicit: background-restored ONI-style indices and event probabilities assume the context-end tropical mean persists across all 14 leads. J1 remains a retrospective control; J4 remains a linear-extrapolation diagnostic.
The broader operational result is more important than a single variant: fresh same-reference retraining accounts descriptively for about 76% of the Phase H gap, versus about 8% for the causal-reference update. Keep the climatology current, but prioritize regular retraining on recent data. Phase I now freezes the 1996–2025 base for 2026–2030, retrains the unchanged recipes on all months through 2025, fixes the new checkpoint SHAs and waits. The first confirmatory read of the deployment products will be prospective E6-LIVE; it has not happened yet. A future live report should add the frozen live pipeline diagram, a relative-versus-background-restored ONI-style panel, and an accumulating lead-by-issue-date live scorecard; no prospective panel may be populated before the live protocol and product SHAs are frozen.
References
- NOAA Climate Prediction Center, “Oceanic Niño Index changes description: centered 30-year base periods updated every five years,” 2017, https://www.cpc.ncep.noaa.gov/products/analysis_monitoring/ensostuff/ONI_change.shtml.
- M. L. L'Heureux, M. K. Tippett, M. C. Wheeler, H. Nguyen, S. Narsey, N. Johnson, Z.-Z. Hu, A. B. Watkins, C. Lucas, C. Ganter, E. Becker, W. Wang, and T. Di Liberto, “A relative sea surface temperature index for classifying ENSO events in a changing climate,” Journal of Climate, 37(4):1197–1211, 2024.
- T. Izumo et al., “Relevance of relative sea surface temperature for tropical rainfall interannual variability,” Geophysical Research Letters, 47, e2019GL086182, 2020.
- A. Capotondi and P. D. Sardeshmukh, “Is El Niño really changing?” Geophysical Research Letters, 44:8548–8556, 2017.
- Y.-G. Ham, J.-H. Kim, and J.-J. Luo, “Deep learning for multi-year ENSO forecasts,” Nature, 573:568–572, 2019.
- S. Rasp and N. Thuerey, “Data-driven medium-range weather prediction with a ResNet pretrained on climate simulations: A new model for WeatherBench,” Journal of Advances in Modeling Earth Systems, 13:e2020MS002405, 2021.
- H. Hersbach et al., “The ERA5 global reanalysis,” Quarterly Journal of the Royal Meteorological Society, 146:1999–2049, 2020.
- Z. Gao et al., “Earthformer: Exploring space-time transformers for Earth system forecasting,” in Advances in Neural Information Processing Systems, vol. 35, 2022.
- T. Gneiting, A. E. Raftery, A. H. Westveld, and T. Goldman, “Calibrated probabilistic forecasting using ensemble model output statistics and minimum CRPS estimation,” Monthly Weather Review, 133:1098–1118, 2005.
- R. Schefzik, T. L. Thorarinsdottir, and T. Gneiting, “Uncertainty quantification in complex simulation models using ensemble copula coupling,” Statistical Science, 28(4):616–640, 2013.
- C. A. T. Ferro, “Fair scores for ensemble forecasts,” Quarterly Journal of the Royal Meteorological Society, 140:1917–1923, 2014.