From Factorized Gaussian Noise to Spatially Correlated Generative Ensembles
Scientific Report 6: Sharpness, Dispersion, and an ENSO Index Calibration Wall (Phases D–E)
Abstract
Held-out head-pretraining results here are E2-SIM; every observed ensemble comparison is E3-VAL. We study whether probabilistic residual heads around the frozen deterministic PB-1 can cure its amplitude damping while preserving its mean. Phase D tests per-coefficient Gaussian heads, jointly trained and calibration-only; Phase E climbs a generative ladder — latent-noise heads (PE-1, PE-1b), a conditional diffusion head (PE-2), its regularized/stochastic variant (PE-2b), and a CMIP-pretrained diffusion head (PE-2c). Four causal findings emerge. (i) Independent per-coefficient noise averages out of the cosine-weighted Niño-3.4 index: with the mean frozen, spread–skill is $0.212$ versus $0.208$ jointly trained — the failure is architectural, not a mean-training artifact. (ii) Spatially correlated latent noise improves index dispersion 2.2-fold ($0.475$) but is capacity-limited: member sharpness stays at $\approx0.40$ under both loss targetings. (iii) Diffusion restores sharp member amplitude (median std ratios $0.812/0.839$ full-field/Niño-3.4) but not diversity — spread–skill $0.466$ — and over-cooks fine scales (highpass energy ratios $1.27/2.44/4.16$); regularizing the over-cook collapses both sharpness and spread, because the excess fine-scale energy was itself supplying them. (iv) A $\sim$64-fold increase in training windows via CMIP pretraining of the head leaves the wall unchanged (spread–skill $0.460$) while delivering the best ensemble mean of any variant (RMSE $0.533<$ PB-1's $0.541$) and the first nonzero probability on the strong 2015 event. Conclusion: data scale alone is insufficient under this objective; the mechanism — coherent, low-mode, state-dependent uncertainty — is handed to the calibration study of Report 7 and the temporal-objective study of Report 8.
1. Study Identity and Evidence Boundary
Study ID R6 / Phases D–E. Incoming baseline: PB-1, frozen. Changed factors: output distribution, spatial covariance structure, head capacity, spectral objective, sampler, and head pretraining data scale. Evidence tiers: E2-SIM for head pretraining; E3-VAL for all observed ensembles. Timeline: Phase D (2026-07-06) precedes the one-shot PB-1 test read; Phase E (2026-07-07 to 07-10) is a new post-test study that develops exclusively on 1981–2015 and never reuses test months. Consultation budgets were waived by user directive on 2026-07-07 (runs remain ledger-predeclared); all probabilistic outcomes are validation evidence. Terminal decision: no head adopted; PB-1 retained; PE-2c designated the best-mean spatial generator and handed to Phase F.
2. Introduction
Three distinct goals are routinely conflated in probabilistic forecasting, and this report keeps them separate throughout. Mean skill is the accuracy of the ensemble center. Member sharpness is whether an individual sample looks like a realistic-amplitude anomaly field rather than a blur — PB-1's deterministic output, at $\approx0.4$ of observed variability, fails this. Calibration is whether ensemble spread matches ensemble-mean error — spread–skill near one, nominal interval coverage. A blurred ensemble mean is proper even when members should be sharp: the conditional expectation of uncertain futures is smooth. And per-pixel variance, however well calibrated pointwise, can vanish under a regional average: the Niño-3.4 index is one linear functional of the field,
so if member perturbations are spatially independent the covariance sum collapses at rate $\sim 1/n_{\mathrm{eff}}$ and the index inherits almost no spread. Equation (1) is the report's organizing principle: it predicts Phase D's failure exactly and frames what any successful head must do — place variance in spatially coherent modes that survive the box average.
3. Focused Literature Review and Consultation
Proper scoring rules. CRPS and the energy score are strictly proper for univariate and multivariate targets respectively [1]; finite ensembles require fair (unbiased) estimators [2]. The energy score's known weakness — comparative insensitivity to dependence mis-specification — matters here, because dependence across space is precisely what (1) taxes; the variogram score family was developed for exactly that gap [3].
Heteroscedastic Gaussian heads. Predicting a per-output variance under Gaussian likelihood is the classic cheap uncertainty model [4]; closed-form Gaussian CRPS [5] provides a proper, optimization-friendly alternative to NLL. Phase D implements both and shows the family's structural ceiling for aggregated targets.
Correlated latent ensembles. Weather-scale generative systems obtain spatially coherent members through shared low-dimensional latents or parameter/function perturbations rather than per-pixel noise; DGMR's latent conditioning [6] and GenCast's diffusion formulation [7] are reference points. PE-1's shared global latent plus coarse upsampled noise field is the minimal instance of this idea.
Regression-mean plus diffusion-residual. CorrDiff-style two-stage designs freeze a deterministic mean and train a generative corrector on the residual [8]; SEEDS emulates ensembles with diffusion [9]. This is Phase E's frame: it protects PB-1's resolvable skill by construction while the head supplies texture and (intendedly) spread.
Diffusion machinery. DDPM $\varepsilon$-prediction training [10], DDIM deterministic/stochastic sampling with the $\eta$ parameter [11], and design-space analyses [12] supply the head's mechanics; spectral/frequency control of generated fields is a recognized issue in generative weather modeling.
The smudginess consultation. A recorded two-stage consultation (2026-07-07) diagnosed PB-1's smoothed appearance as the loss's fingerprint — conditional-mean regression, an amplitude-blind dominant ACC term, and a one-sided overshoot-only energy hinge — and adjudicated the generative direction. Its conclusions, adopted here: deterministic amplitude penalties were already exhausted (Report 2's A–E/amp035/skill-v1 record); a discriminator-based GAN is disfavored at 335 windows (discriminator overfit, minimax instability, and mode collapse that would look like the damping being cured); and proper-score or denoising objectives buy the same “feasibility” pressure with fewer failure modes [1]. The original project design had in fact preferred a conditional diffusion head; the pivot away had been cost sequencing, not refutation.
4. Common Experimental Boundary
Every Phase D/E variant shares: the immutable PB-1 mean pathway (overlaid exactly; the mean_head reproduces PB-1's validation metrics to the digit in every run); corrections/residuals modeled in normalized lifted coefficient space; inverse DTCWT per member; 32-member validation evaluation; a shared .mean/.sample checkpoint contract with geometry validation (sampler knobs excluded); and the generative_head_only freeze policy — the entire mean pathway frozen, only the head trains, so the mean guardrail holds by construction. Early Phase-D-era artifacts use the finite-ensemble empirical CRPS ($M^2$ denominator, all 14 leads); later Phase E–G comparisons use fair $M(M-1)$ CRPS over leads 3–14 — values are never ranked across that boundary without recomputation.
4.1 Common Forecast Coordinates
$24\times48$ tropical Pacific; 12 context / 14 target months; train 1981–2010; validation 2011–2015 (35 windows); no Phase D/E test-month use (test_data_read: false in every artifact); cosine-weighted Niño-3.4 with leads-3–14 headline scope; persistence and zero-anomaly baselines; 32-member standard evaluation.
5. Metrics and Adoption Gates
Alongside the ensemble-mean D1–D6 scorecard, the probabilistic extension enters here: P1 fair CRPS, P2 spread–skill, P3 coverage, PE-style P4a member sharpness, P5a coefficient-spectrum ratios, and P6 rank/threshold/case diagnostics (P4b/P5b are reserved for Report 7's lifting integrity). The predeclared gates: mean guardrail (ensemble-mean Niño-3.4 correlation not resolvably below PB-1; no resolvable RMSE regression $\ge+0.005\,{}^{\circ}\mathrm{C}$); calibration (Niño-3.4 spread–skill in $[0.8,1.2]$; 50/80/90% coverage within $\pm10$ points; ensemble CRPS below the spread-free deterministic reference); and sharpness (median per-member full-field std ratio in $[0.7,1.3]$ and Niño-3.4 ratio $\ge0.7$). Lead scopes (all-14 versus 3–14) are stated per table.
6. Phase D: Factorized Gaussian Study
The head predicts a per-coefficient log-variance over the normalized residual; with mean $\mu$ and variance $\sigma^2$ per coefficient, training minimizes either the masked heteroscedastic NLL,
or the closed-form Gaussian CRPS (proper; verified against Monte-Carlo empirical CRPS to $5\times10^{-3}$),
[5]. An earlier V7-initialized NLL variant had already shown severe under-dispersion (Niño-3.4 90% coverage $25.9\%$); Phase D's two predeclared consultations used (3).
6.1 PD-1: Joint CRPS Training
Training mean and variance jointly degraded the mean (ensemble-mean Niño-3.4 correlation $0.420$ vs PB-1's $0.616$) and left the index severely under-dispersed: spread–skill $0.208$, 90% coverage $28\%$. Fails both criteria.
6.2 PD-2: Calibration-Only Isolation
Freezing PB-1's mean exactly (checkpoint overlay + variance_head_only) and training only the log-variance head isolates the covariance question from mean training. The mean guardrail passes by construction (RMSE $0.5415$, correlation $0.6157$, identical to PB-1) — and the index is still under-dispersed: spread–skill $\mathbf{0.212}$, essentially PD-1's $0.208$; 90% coverage $37\%$. The near-identical failure with the mean frozen proves the failure is architectural: by (1), independent per-coefficient variance cannot inflate the index spread, whatever its magnitude. Both Phase D consultations spent; Phase D closed.
Each rung changes a declared factor around the same frozen mean (Table 1; Fig. 1).
| Rung | Distribution | Changed factor | P2 | P4a full/Niño-3.4 | P5a hp1/2/3 | verdict |
|---|---|---|---|---|---|---|
| PD-1 | Gaussian, joint | — | 0.208 | — | — | mean + calib. fail |
| PD-2 | Gaussian, frozen mean | isolate mean | 0.212 | — | — | architectural |
| PE-1 | latent noise | spatial correlation | 0.475 | 0.398 / 0.362 | $\approx$1.0 flat | damped members |
| PE-1b | latent noise | residual band target | 0.454 | 0.402 / 0.359 | 1.01/1.44/1.49 | capacity limit |
| PE-2 | diffusion | expressive generator | 0.466 | 0.812 / 0.839 | 1.27/2.44/4.16 | sharp, over-cooked |
| PE-2b | diffusion | band reg. + $\eta{=}1$ + 2$\times$ steps | 0.227 | 0.52 / 0.54 | –/–/3.45 | regressed |
| PE-2c | diffusion | CMIP-pretrained head | 0.460 | 0.62 / 0.695 | –/–/3.43 | best mean; wall stands |
E3-VAL, 32 members, frozen PB-1 mean). P2 is Niño-3.4 spread–skill (target $[0.8,1.2]$); P4a median member std ratios (gates $[0.7,1.3]$ full-field, $\ge0.7$ Niño-3.4); P5a member/truth band RMS ratios (target $\approx1$).7.1 PE-1 and PE-1b: Latent Noise
The latent_noise_residual head draws, per member, one global latent vector plus a coarse bilinearly upsampled noise field — both shared across space, bands, and leads — so member perturbations are spatially correlated by construction, directly targeting the Phase-D mechanism. The delta projection is zero-initialized (members equal the mean at step 0). Training optimizes proper scores only:
with $\mathrm{ES}_w$ the latitude-weighted fair energy score, $\mathrm{CRPS}_{\text{Niño-3.4}}$ the sample CRPS of the index, $\mathcal{L}_{\mathrm{band}}$ a two-sided per-sample band-RMS match, and the last term a soft ensemble-mean anchor. There is deliberately no deterministic amplitude penalty (Report 2's stop rule stands).
PE-1 outcome. Mean preserved exactly; index dispersion improved 2.2$\times$ over Phase D (spread–skill $0.475$) — confirming the per-coefficient-independence diagnosis — but calibration still fails (90% coverage $66\%$) and sharpness fails badly: member std ratios $0.398/0.428/0.362$ (full/equatorial/Niño-3.4). Diagnosis: the energy score is minimized by keeping members near the damped mean when true variability is unpredictable, and the band term read $\approx1.0$ trivially because it scored persistence-dominated absolute coefficients.
PE-1b retargets the band term at the member's departure-from-persistence (weight $0.05\to0.25$) — the only change. The fix works mechanically (band ratios move to $1.01/1.44/1.49$, the cleanest spectrum of the ladder), and sharpness does not move ($0.402/0.359$). The retargeting moved the spectrum but not the amplitude: PE-1's damping is head capacity, not loss targeting. A low-rank additive perturbation cannot inject realistic-amplitude structure however it is scored.
7.2 PE-2: Conditional Diffusion
The diffusion_residual head is a FiLM-conditioned convolutional DDPM over the correction $x_0$ (truth minus frozen mean) in lifted coefficient space, trained with $\varepsilon$-prediction denoising MSE [10],
sampled with 50-step DDIM [11] (spatial convolutions make members coherent; the $x_0$ estimate is clamped each reverse step for stability). The lead axis is folded into the batch — each month denoised independently — a structural fact that becomes Report 8's subject.
Outcome. Sharpness passes for the first time: member std ratios $0.812/0.800/0.839$ — a rendered member is a sharp, realistic-amplitude field; the member-level smudge is cured. But calibration still fails (spread–skill $0.466\approx$ PE-1) because sharp members are insufficiently diverse, and the spectrum is over-cooked: highpass member/truth energy ratios $1.27/2.44/4.16$. Two complementary failure modes are now mapped: PE-1 keeps the spectrum and damps members; PE-2 sharpens members and over-cooks fine scales, under-dispersing either way.
7.3 Sampler and Clamp Sweep
Inference-only ablations on the PE-2 checkpoint (Table 2): tightening the $x_0$ clamp ($4.0\to2.0\to1.5$) drops sharpness $0.81\to0.50\to0.45$ — the clamp is a coupled sharpness$\leftrightarrow$over-cook knob and cannot fix the spectrum without destroying amplitude; stochastic DDIM at $\eta=1$ lifts spread–skill $0.466\to0.508$ at preserved sharpness. Sampler knobs modulate the trade; none breaks it.
| Inference-only change (PE-2 checkpoint) | P4a full-field | P2 |
|---|---|---|
| reference ($x_0$ clamp 4.0, $\eta=0$) | 0.81 | 0.466 |
| clamp 2.0 | 0.50 | — |
| clamp 1.5 | 0.45 | — |
| stochastic DDIM, $\eta=1$ (clamp 4.0) | $\approx$0.81 (preserved) | 0.508 |
7.4 PE-2b: Spectral Regularization
PE-2b combines three diagnosed fixes: a two-sided aggregate band-energy penalty on the denoiser's one-step $x_0$ estimate (weight 0.1), $\eta=1$ sampling, and doubled training. It regressed on every gate: sharpness $0.81\to0.52$, spread–skill $0.466\to0.227$, over-cook barely moved (hp3 $4.16\to3.45$), ensemble-mean RMSE $0.546\to0.593$. The post-mortem is instructive: (i) the regularizer constrained the one-step estimate while members come from the 50-step chain, which re-accumulates over-cook; (ii) PE-2's sharpness and diversity were partly provided by the over-cook — excess fine-scale energy pads both per-member variance and member-to-member spread — so penalizing it collapsed both; (iii) the lower-energy regularized denoiser left $\eta=1$ nothing to diversify.
7.5 PE-2c: CMIP Diffusion-Head Pretraining
The last untried lever was data scale. The diffusion head was pretrained on 21,505 CMIP correction windows (v3 backbone frozen, pure denoising objective (5), held-out selection on the three Phase-B holdout models) — held-out denoising loss fell $0.99\to0.396$ monotonically with train $\approx$ held-out (E2-SIM: a clean, generalizing pretraining) — and transferred to the observed model via a weights-only, normalization-agnostic head checkpoint, then fine-tuned 1,000 observed steps in PE-2's exact setup.
Outcome. The transfer helped in real ways: the 32-member ensemble mean is the best point forecast of any variant (Niño-3.4-index RMSE $0.5326 <$ PB-1's $0.5407$; correlation $0.597$); over-cook is milder than PE-2; and for the first time the ensemble places nonzero mass on the strong 2015 event ($P(\mathrm{peak}>1.0\,{}^{\circ}\mathrm{C})=0.094$ versus $0.0$ in every prior variant — the head has seen many simulated El Niños). But calibration is unchanged: spread–skill $0.460$, statistically identical to PE-1's $0.475$ and PE-2's $0.466$. A $\sim$64-fold data increase moved the wall by approximately nothing. Sharpness narrowly fails ($0.62/0.695$) — PE-2's $0.81$ was partly over-cook-inflated, and the less over-cooked PE-2c reads lower on a variance-based metric. Not adopted; PB-1 retained.
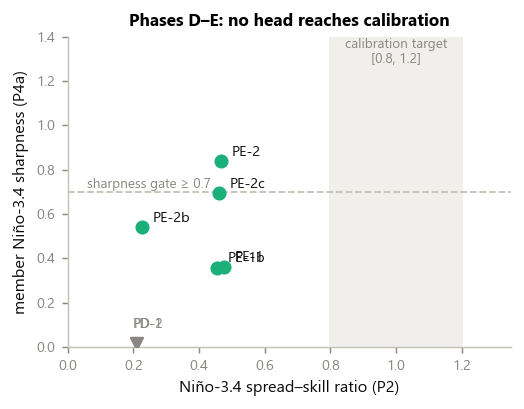
P2 vs P4a); no rung enters the target region, and sharpness–spread trades dominate the ladder. Bottom: P5a spectral ratios — PE-1's flat-but-damped bands, PE-1b's clean retargeted spectrum, PE-2's over-cook, and its persistence under regularization and pretraining.8. Cross-Experiment Results Synthesis
Confirmed causal findings: factorized averaging (PD-2: frozen mean, unchanged under-dispersion); latent capacity (PE-1b: spectrum moved, amplitude did not); spectral over-cook as measured mechanism (PE-2 ratios; PE-2b collapse when suppressed); data scale insufficient under this objective (PE-2c: $64\times$ windows, $\Delta$spread–skill $\approx0$). Hypotheses left open, deliberately: whether the denoising objective's allocation across scales — not the architecture or the data — starves the coherent modes (Report 8 answers this affirmatively), and whether post-hoc calibration can rescue the existing rank information (Report 7). The Phase-E record is the empirical basis of the ensemble-calibration research brief that commissioned the external literature survey guiding Phase F.
9. Persistent Series Scorecard
Table 1 carries P2/P4a/P5a; supplementary rows: PD-2 90% coverage $36.9\%$; PE-1 coverage $65.9\%$; PE-2 coverage $67\%$; PE-2c ensemble-mean RMSE $0.5326$ / correlation $0.597$ (mean-head exactly PB-1 in every rung: RMSE $0.5407$, correlation $0.6157$, ACC $0.3579$). Evidence badges: pretraining rows E2-SIM; everything else E3-VAL. X4: PD-1 ce129666…, PD-2 78391375…, PE-1 ab83582f…, PE-1b 3f21c75c…, PE-2 43c21c30…, PE-2b 690e666a…, CMIP head fa50768b…, PE-2c 8ad14ac0…; frozen mean c6b49723… on v3 backbone 2247c1f9…; test_data_read: false throughout. A canonical member artifact/seed should be designated per final table, with evaluator-seed (42) versus script-seed sensitivity noted rather than mixed; and legacy ($M^2$, all-lead) versus fair ($M(M-1)$, leads 3–14) CRPS values must be recomputed under one estimator before any definitive cross-row ranking.
10. Discussion
Member sharpness and ensemble dispersion are orthogonal axes, and the ladder populates all four quadrants: PD (neither), PE-1 (dispersion progress, no sharpness), PE-2 (sharpness, no dispersion), PE-2b (neither, having started from PE-2). The connecting mechanism is (1): highpass energy can make members individually vivid while contributing variance that cancels in the box average — fake diversity, purchased at the fine scales. The PE-2c result then closes the cheapest remaining explanation: the wall is not data starvation. What remains open at this report's boundary, and is flagged rather than concluded: the denoising objective's per-cell weighting may simply never reward uncertainty in the coherent low modes — an objective-allocation hypothesis that Phase G later confirms causally with the band-weighted loss. The constructive handoff is that calibration must act directly on the coherent low-dimensional ENSO modes (the index projection first among them), which is Phase F's charter.
11. Limitations and Adaptive-Validation Disclosure
Thirty-five overlapping windows; multiple post-test exploratory iterations after consultation budgets were waived (every run predeclared in the ledger, but validation reuse is extensive from PE-2 onward); finite 32-member Monte-Carlo noise in all gate metrics; the CRPS estimator and lead-scope boundary between Phase-D-era and Phase-E artifacts; frozen-mean constraints (members orbit a damped center — the frame itself may cap calibration, a possibility the Phase-F plan later relaxes); limited diffusion capacity (a small conv denoiser); and one strong event dominating the validation slice. No Phase D/E head was tested on 2016–2020 here; Report 8 documents the one amended test of the G2-long descendant after adoption.
12. Conclusion and Transition to Report 7
Spatial diffusion solves individual-member smudginess — the user-facing symptom that launched the program — but not the regional calibration wall, which survives changes of distribution family, loss targeting, sampler, and a 64-fold data increase. The phase hands forward: PE-2c as the best-mean spatial generator (checkpoint 8ad14ac0…); its saved per-member Niño-3.4 trajectories; the per-band diagnostic tooling; and the sharpened requirement that follows from (1) — projection-aware calibration and coherent lowpass uncertainty, the subject of Report 7.
References
- T. Gneiting and A. E. Raftery, “Strictly proper scoring rules, prediction, and estimation,” Journal of the American Statistical Association, 102:359–378, 2007.
- C. A. T. Ferro, “Fair scores for ensemble forecasts,” Quarterly Journal of the Royal Meteorological Society, 140:1917–1923, 2014.
- M. Scheuerer and T. M. Hamill, “Variogram-based proper scoring rules for probabilistic forecasts of multivariate quantities,” Monthly Weather Review, 143:1321–1334, 2015.
- D. A. Nix and A. S. Weigend, “Estimating the mean and variance of the target probability distribution,” in IEEE International Conference on Neural Networks, 1994.
- T. Gneiting, A. E. Raftery, A. H. Westveld, and T. Goldman, “Calibrated probabilistic forecasting using ensemble model output statistics and minimum CRPS estimation,” Monthly Weather Review, 133:1098–1118, 2005.
- S. Ravuri et al., “Skilful precipitation nowcasting using deep generative models of radar,” Nature, 597:672–677, 2021.
- I. Price et al., “Probabilistic weather forecasting with machine learning,” Nature, 637:84–90, 2025.
- M. Mardani et al., “Residual corrective diffusion modeling for km-scale atmospheric downscaling,” arXiv:2309.15214, 2023.
- L. Li, R. Carver, I. Lopez-Gomez, F. Sha, and J. Anderson, “Generative emulation of weather forecast ensembles with diffusion models,” Science Advances, 10:eadk4489, 2024.
- J. Ho, A. Jain, and P. Abbeel, “Denoising diffusion probabilistic models,” in Advances in Neural Information Processing Systems, vol. 33, 2020.
- J. Song, C. Meng, and S. Ermon, “Denoising diffusion implicit models,” in International Conference on Learning Representations, 2021.
- T. Karras, M. Aittala, T. Aila, and S. Laine, “Elucidating the design space of diffusion-based generative models,” in Advances in Neural Information Processing Systems, vol. 35, 2022.