FOMC Statement Sentiment and the 2-Year Yield Reaction
Abstract
We score 138 Federal Reserve FOMC statements from 2010 to April 2026 with a pinned FinBERT classifier and regress the change in statement sentiment on a 30-minute proxy-series 2-year yield move centered on each release minute. After excluding 50 releases that lack a verified minute-level timestamp (predominantly 2010–2015) and one emergency release with insufficient intraday coverage, the baseline sample contains 88 releases. The $[-15,+15]$ minute window yields an HAC-robust slope of $\hat{\beta}=-2.31$ (95% CI $[-7.11, +2.49]$, $p=0.345$, $R^{2}=0.005$): the relationship is statistically indistinguishable from zero and opposite in sign to the economic prior. The five largest absolute residuals all fall on press-conference days. Restricting the dependent variable to the press-conference window $[+30,+90]$ on press-conference days $(n=71)$ flips the sign and roughly triples the explained variance ($\hat{\beta}=+2.87$, $p=0.211$, $R^{2}=0.017$), suggesting that whatever signal exists in FinBERT-coded statement tone is most visible during the press conference rather than the statement read itself. The intraday market leg is a Treasury futures proxy, not the cash 2-year yield; all magnitudes should be interpreted accordingly.
Proxy-series substitution. The intraday market leg used here is the front-month 2-year Treasury futures contract sampled at 30-minute frequency, serving as a proxy for the cash 2-year Treasury yield. The two series co-move strongly at low frequency, but minute-level moves can include futures-specific microstructure that does not appear in cash yields. Every figure and coefficient in this report is accordingly expressed in proxy-series units: roughly basis-point scale and matching the qualitative direction of cash moves around FOMC events, but not directly interpretable as cash 2-year basis points.
1. Introduction
The 2-year Treasury yield is the cleanest market read on near-term monetary policy expectations, and the FOMC statement is the largest scheduled communication shock that moves it. A long line of work (Kuttner, 2001; Gürkaynak, Sack, and Swanson, 2005; Nakamura and Steinsson, 2018) extracts a policy-rate action surprise from federal funds futures around FOMC announcements; what statement-text scoring adds is a candidate signal for the verbal or non-rate-action component of the same release. The question we ask is whether a pre-trained FinBERT classifier, without Fed-specific fine-tuning, can recover enough hawkish-versus-dovish content from each statement to predict the immediate 30-minute proxy-yield response.
The brief is intentionally narrow: a single dependent variable (the proxy-yield delta in a $[-15,+15]$ minute window), a single explanatory feature (the change in statement-level sentiment versus the previous statement), and a single estimator (HAC-robust OLS). Stratification by monetary-policy cycle, sensitivity across alternate windows, outlier-robustness checks, and a press-conference window are reported as robustness exercises rather than as competing headline models.
2. Data
2.1 Statement corpus
Statements were scraped from federalreserve.gov for the window 2010-01-01 through April 29, 2026. Raw HTML for each release is archived, and cleaned plaintext bodies are extracted with a deterministic HTML-to-text routine and split into sentences with a deterministic splitter so that sentence identifiers are stable across reruns of the scorer.
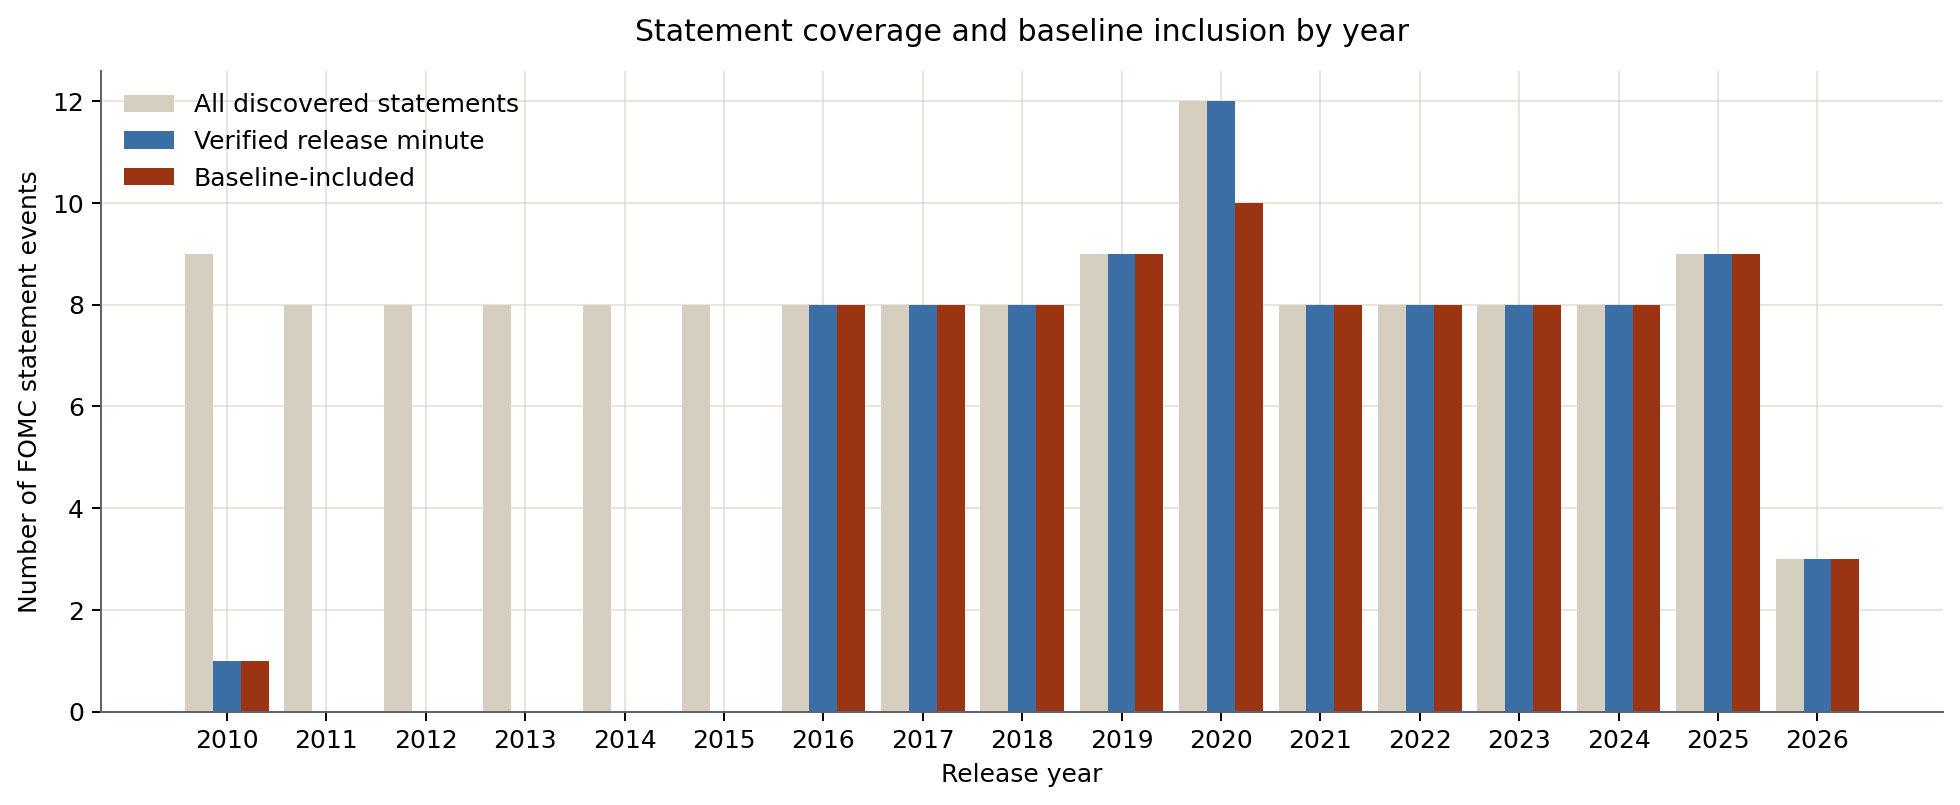
Of the 138 statements discovered, all carry archived HTML, cleaned plaintext, and a sentiment score; 90 also carry a verified minute-level release timestamp from the official Federal Reserve calendar, and 88 of those 90 additionally have complete intraday coverage for the baseline window. The 50 releases that fall out of the regression sample are predominantly 2010–2015 statements for which the official page does not publish a release minute. Figure 1 shows the distribution by year.
2.2 Sentiment scoring
Sentence-level scoring uses the FinBERT classifier from ProsusAI, pinned to a fixed revision so that re-running the model on the same statement text reproduces the same scores. The classifier's native three-class output (positive, neutral, negative) is mapped explicitly to hawkish, neutral, and dovish; no implicit re-labeling occurs. A signed sentence score $s_{t,j}$ is computed as $\Pr(\text{hawkish}) - \Pr(\text{dovish})$, and a statement-level score is the token-count-weighted average over the $N_t$ sentences in statement $t$:
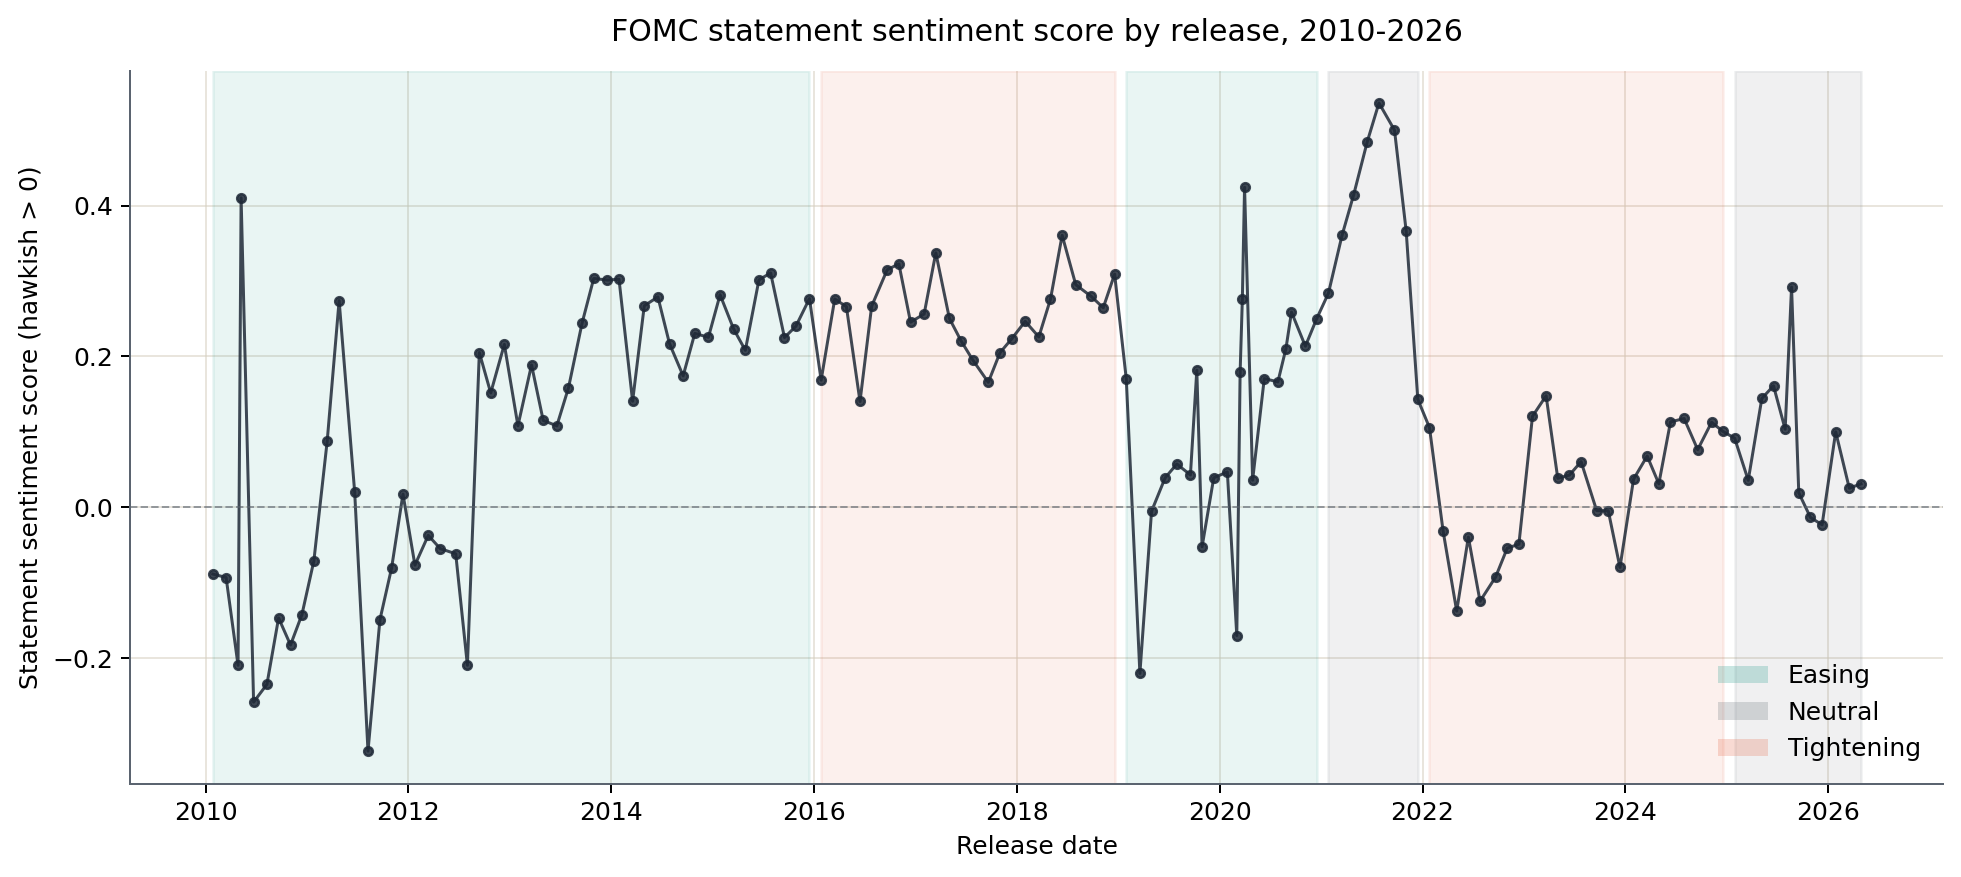
Figure 2 plots $S_t$ across the sample. The series spends 2010–2015 mildly dovish, swings hawkish through the 2016–2018 hiking cycle, collapses around the COVID emergency releases of March 2020, and drifts neutral in 2024–2026 as the FOMC paused after its tightening cycle.
2.3 Yield series
The intraday leg is the 30-minute nearby front-month 2-year Treasury futures series. The Federal Reserve's H.15 daily 2-year constant-maturity yield is retained as a low-frequency reference series only and is not used in the event-window calculations; all baseline deltas come from the intraday futures bars. See the proxy-series disclosure box above for what this substitution implies for interpretation.
2.4 Cycle labels
Each release is tagged tightening, easing, or neutral using a manual date-range rule based on the prevailing federal funds target path. Tightening covers the 2016–2018 and 2022–2024 hiking cycles, easing covers the 2010 post-crisis accommodation visible in the sample as well as the 2019 cuts and the 2020 COVID-era emergency sequence, and neutral covers the on-hold periods in 2021 and 2025–2026. Counts in the baseline-included sample are 48 tightening, 20 easing, and 20 neutral releases.
3. Sentiment Validation
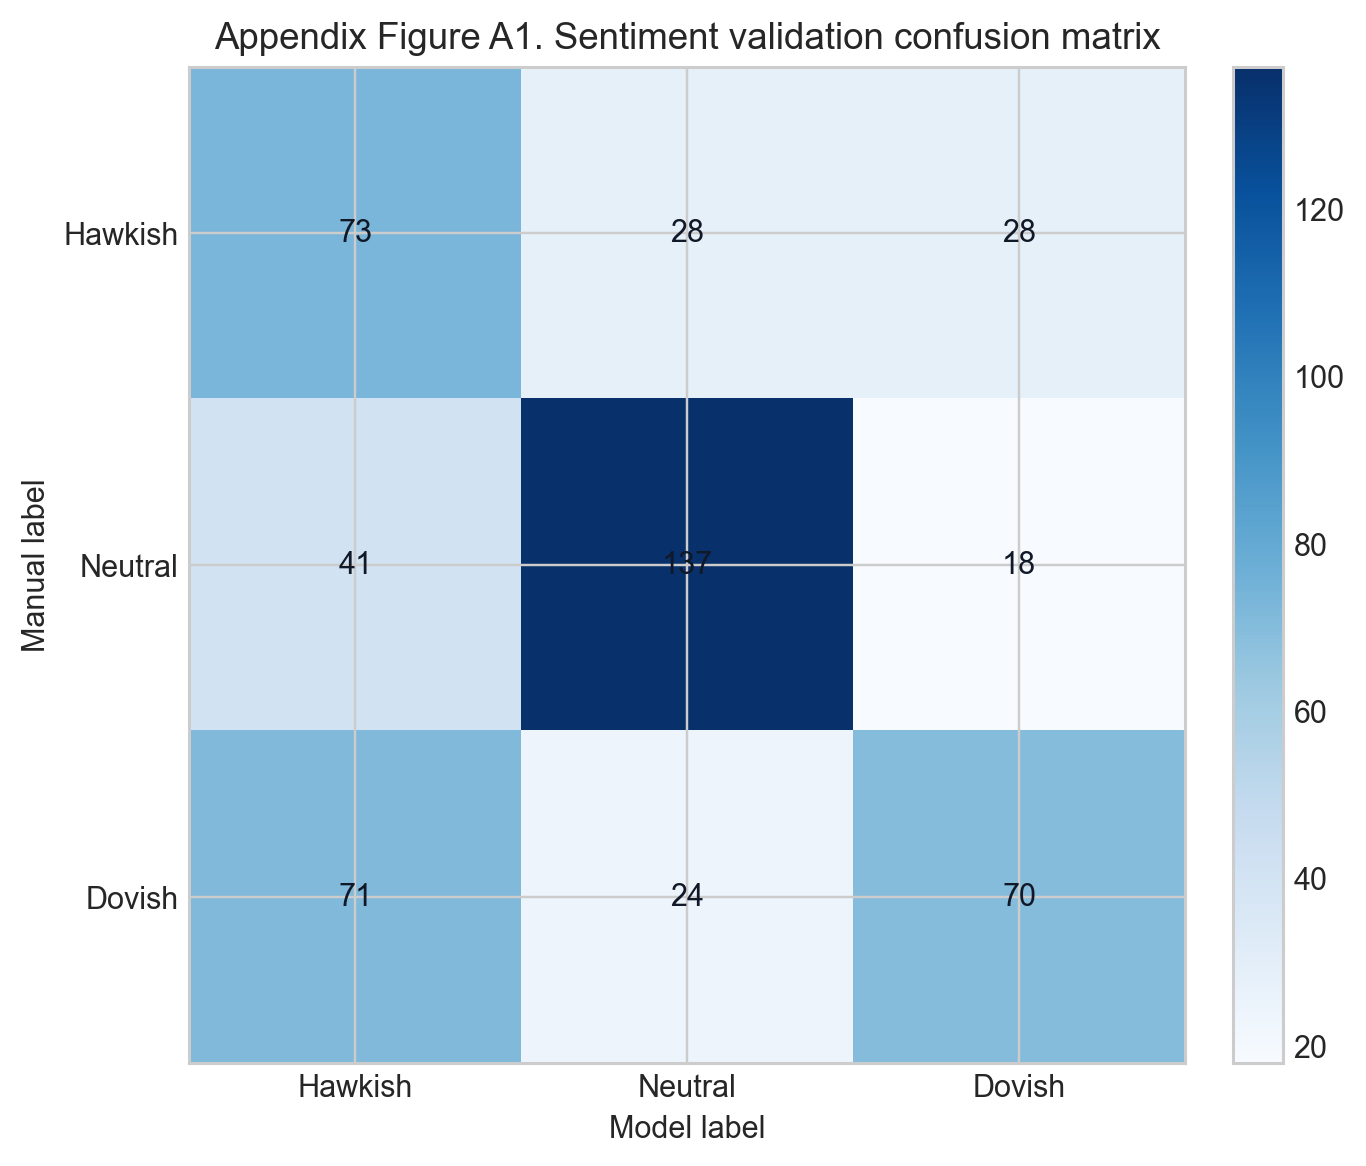
A regime-stratified sample of 30 statements was drawn for hand-coding, yielding 800 candidate sentences. Each sentence was labeled hawkish, neutral, dovish, or exclude; 310 sentences were marked exclude (boilerplate, voting blocs, or genuinely ambiguous policy language), leaving 490 evaluated sentences.
| Class | Precision | Recall | F1 | Support |
|---|---|---|---|---|
| Hawkish | 0.395 | 0.566 | 0.465 | 129 |
| Neutral | 0.725 | 0.699 | 0.712 | 196 |
| Dovish | 0.603 | 0.424 | 0.498 | 165 |
The dominant failure mode is dovish $\to$ hawkish confusion: 71 of the 165 hand-coded dovish sentences were assigned hawkish by FinBERT, against only 28 of 129 hand-coded hawkish sentences assigned dovish (Appendix Figure 8). Out-of-domain FinBERT systematically over-predicts hawkish content in FOMC text. This biases the measured $\Delta S_t$ upward in periods when the true tone is shifting dovish, and downward in genuinely hawkish pivots. We do not calibrate this away in the headline model.
4. Event-Window Construction
For each release with a verified minute-level timestamp $t$, the proxy-series delta over a window $[a,b]$ is
using a last-observation-before / first-observation-after lookup with a 20-minute tolerance. Lookups that exceed this tolerance are treated as inadequate coverage and excluded from the baseline. The baseline window is $[-15, +15]$ minutes; three alternate windows ($[0,+30]$, $[-30,+30]$, and $[-15,+45]$) are computed for sensitivity analysis but are never substituted into the headline. A press-conference window $[+30,+90]$ is added in Section 8.
Of the 90 releases with verified minute-level timestamps, 88 pass the baseline window-coverage check. Two are dropped for inadequate coverage: the 2020-03-15 emergency Sunday release, which has no intraday bars within tolerance before the event, and the 2020-08-27 Jackson Hole speech-day release.
5. Headline Result
The baseline regression is
fit by OLS with HAC standard errors at a one-lag setting. The point estimate is $\hat{\beta}=-2.31$ (95% CI $[-7.11, +2.49]$, $p=0.345$, $R^{2}=0.005$). The slope is statistically indistinguishable from zero, and the sign is opposite the economic prior that a hawkish surprise ($\Delta S_t > 0$) should push 2-year yields higher.
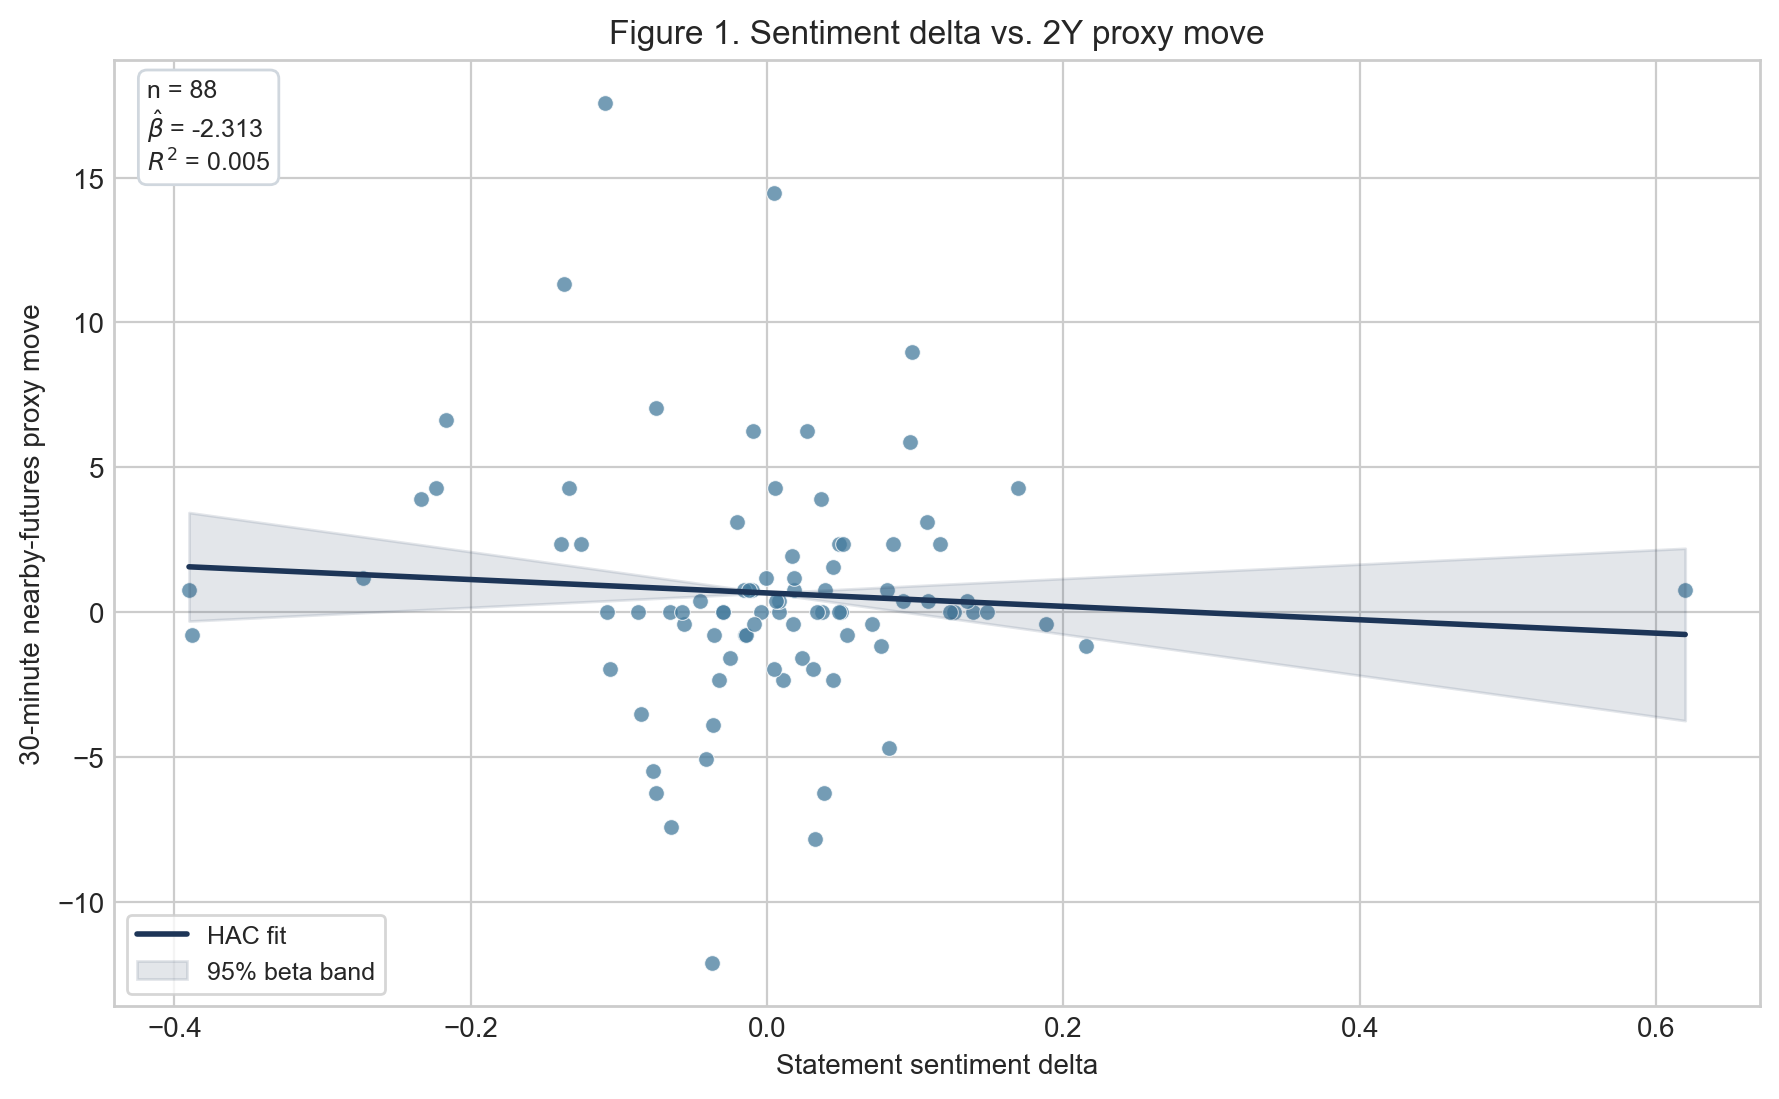
The headline metric is therefore an honest null: statement sentiment delta explains roughly 0.5% of the variance in the 30-minute proxy-series move across 88 FOMC releases since 2010. We unpack three explanations for this null in Section 9.
6. Robustness
6.1 Window sensitivity
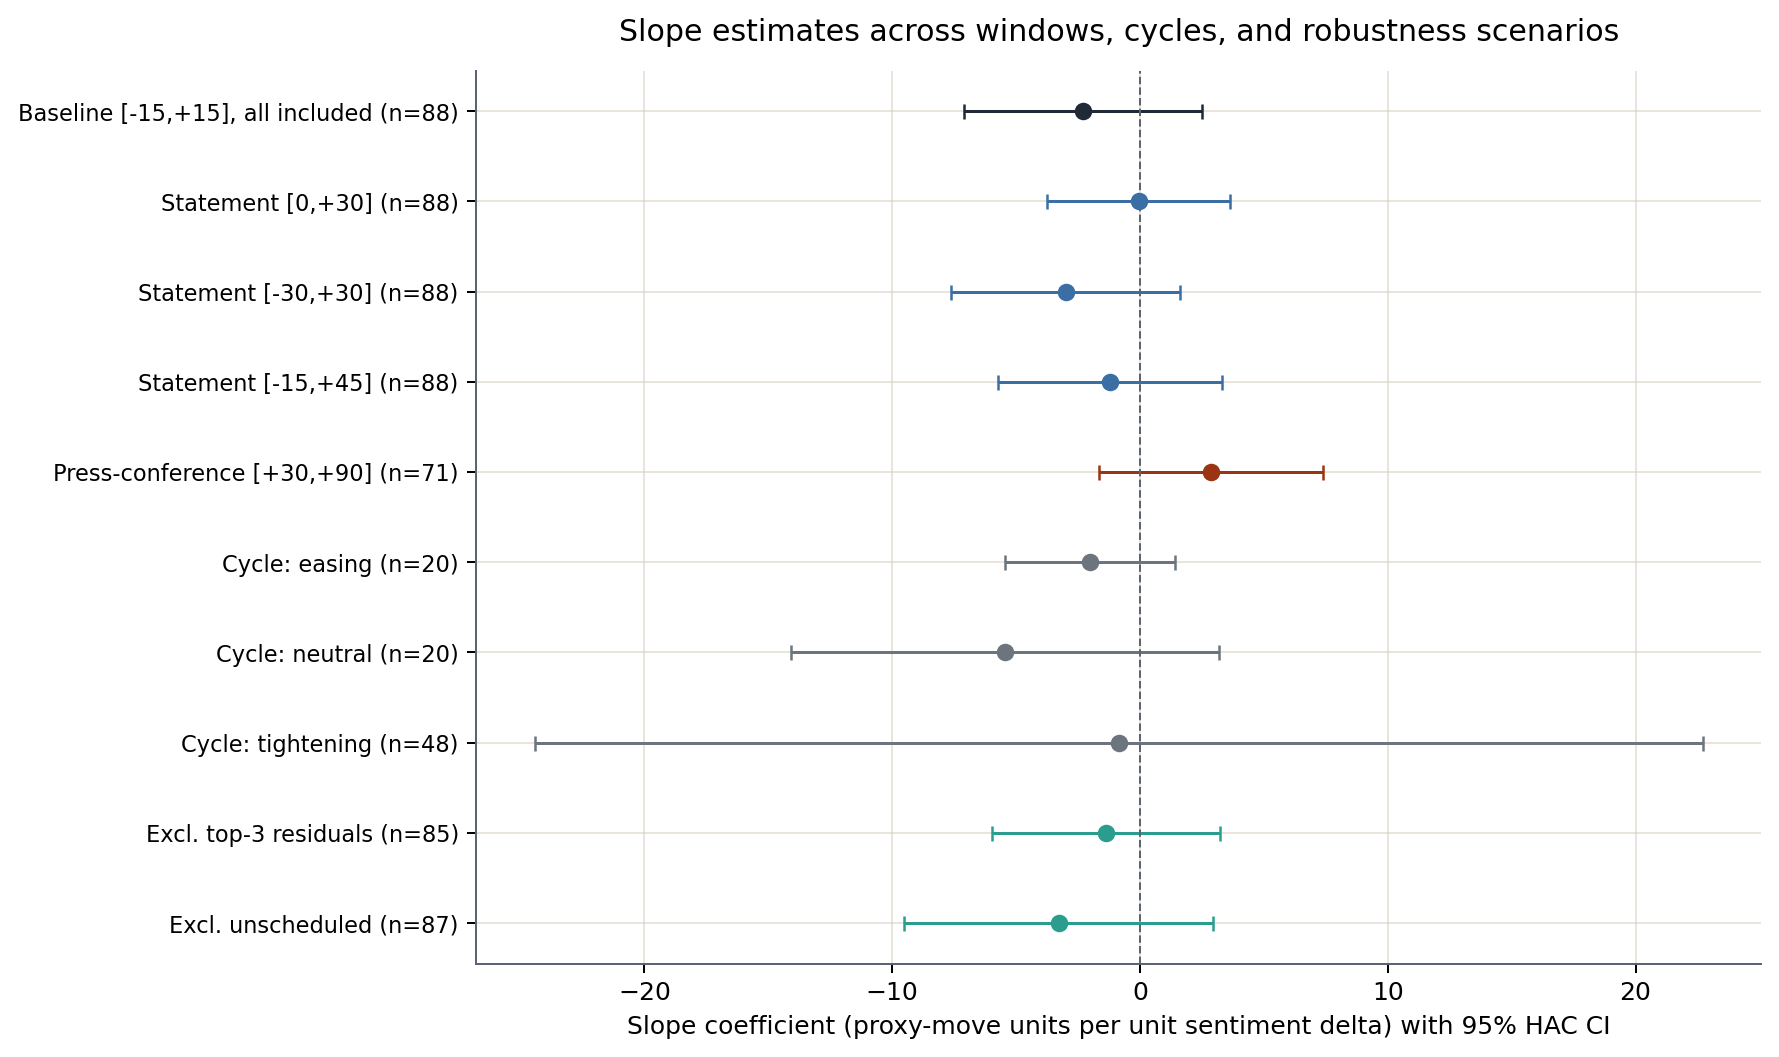
Re-running the same model with each of the three alternate windows (Table 2; Figure 5) leaves the qualitative conclusion unchanged: no window produces a slope distinguishable from zero, and the sign is negative in three of four windows.
| Window (minutes) | $\hat{\beta}$ | 95% CI | $p$ | $R^{2}$ |
|---|---|---|---|---|
| Baseline $[-15,+15]$ | $-2.313$ | $[-7.111,\;+2.486]$ | 0.345 | 0.005 |
| $[0,+30]$ | $-0.054$ | $[-3.730,\;+3.623]$ | 0.977 | 0.000 |
| $[-30,+30]$ | $-3.002$ | $[-7.633,\;+1.629]$ | 0.204 | 0.008 |
| $[-15,+45]$ | $-1.212$ | $[-5.745,\;+3.321]$ | 0.600 | 0.001 |
6.2 Outlier sensitivity
Excluding the three largest absolute residuals (2023-05-03, 2024-07-31, and 2022-01-26) shrinks the magnitude but does not change the sign or significance ($\hat{\beta}=-1.38$, $p=0.557$, $R^{2}=0.003$, $n=85$). Excluding the single unscheduled meeting in the included sample (2010-05-09) actually moves the slope further negative ($\hat{\beta}=-3.27$, $p=0.304$, $R^{2}=0.007$, $n=87$), so the headline result is not driven by the one emergency release.
6.3 Cycle stratification
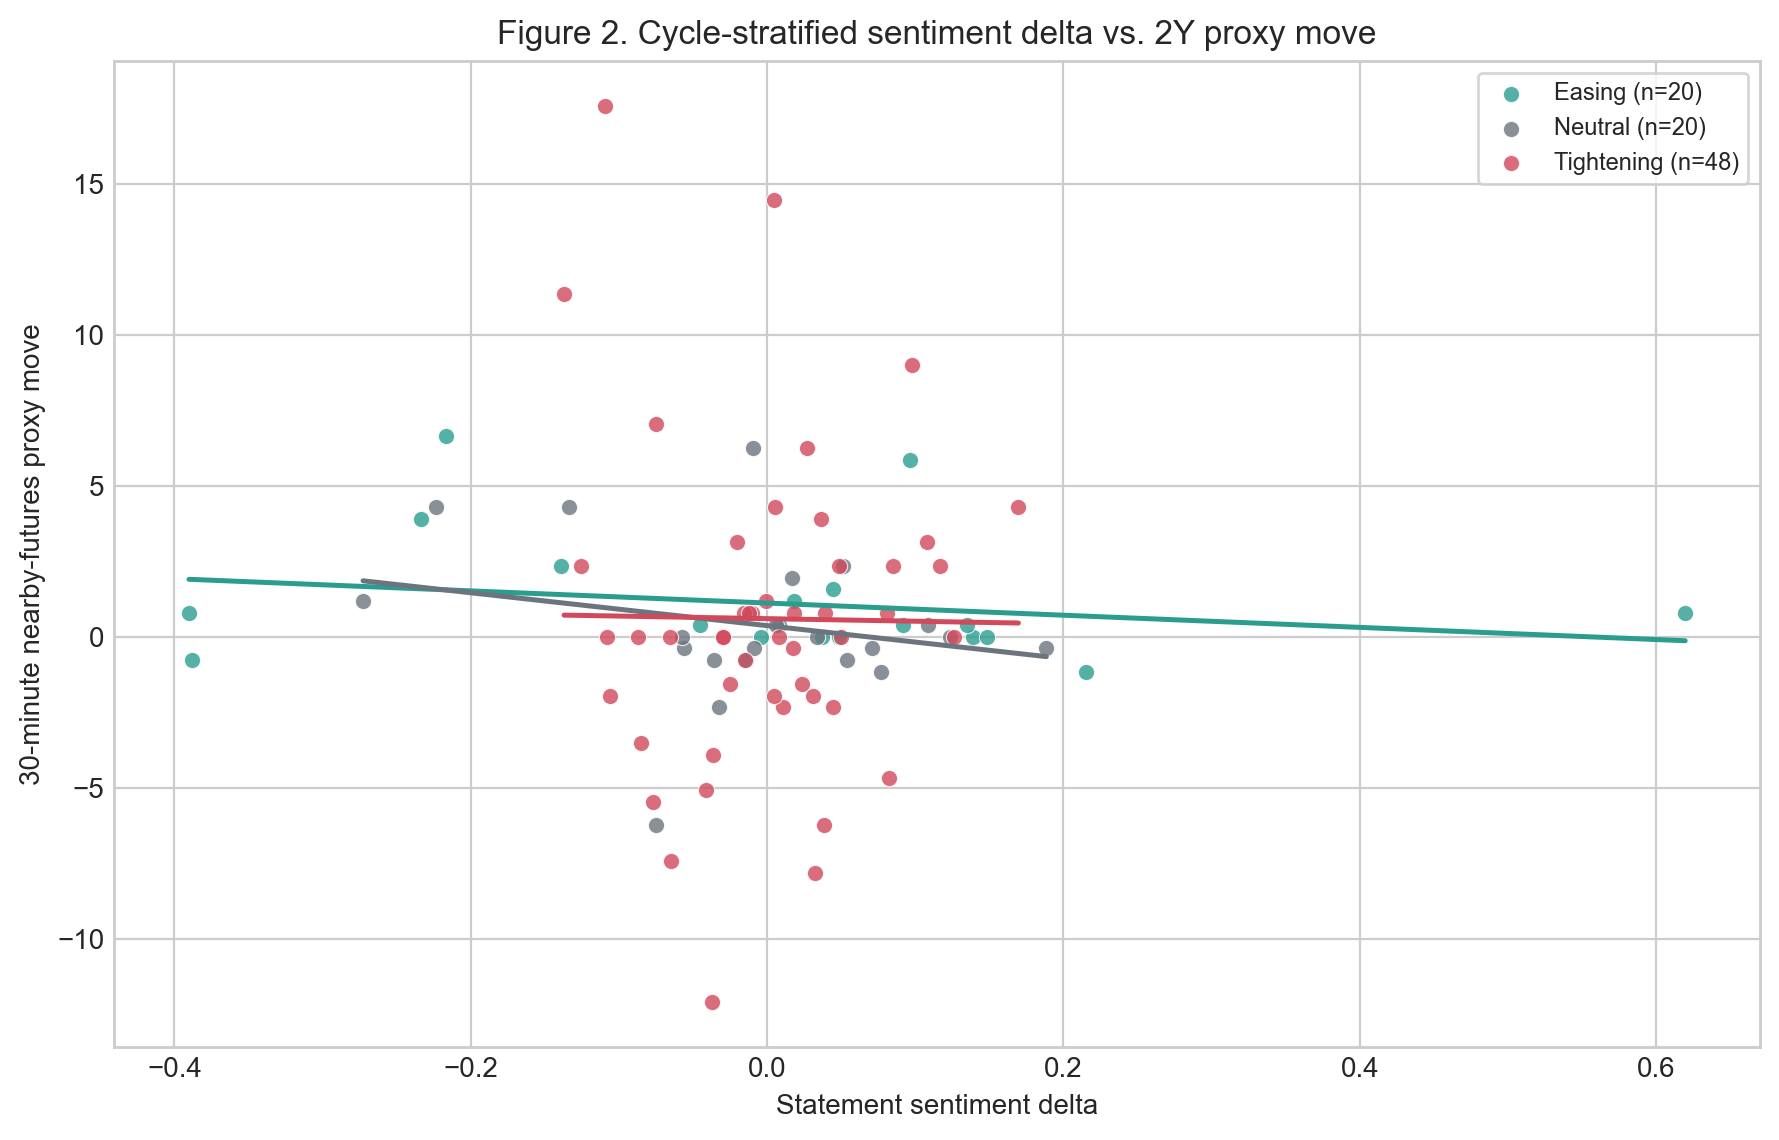
Stratifying the baseline regression by cycle label (Table 3) shows no stratum with a defensible slope. Tightening (48 releases) has the widest HAC standard error—wide enough that the 95% CI spans $[-24.4, +22.7]$—because the post-2021 hiking cycle contains the largest absolute proxy moves and the most volatile residuals in the entire sample. Neutral and easing strata individually produce negative slopes with $p$-values above 0.21.
| Cycle | $n$ | Mean $\Delta y$ | $\hat{\beta}$ | 95% CI | $R^{2}$ |
|---|---|---|---|---|---|
| Easing | 20 | $+1.09$ | $-2.014$ | $[-5.44,\;+1.41]$ | 0.046 |
| Neutral | 20 | $+0.41$ | $-5.443$ | $[-14.08,\;+3.20]$ | 0.053 |
| Tightening | 48 | $+0.59$ | $-0.853$ | $[-24.42,\;+22.71]$ | 0.000 |
7. Residual Analysis
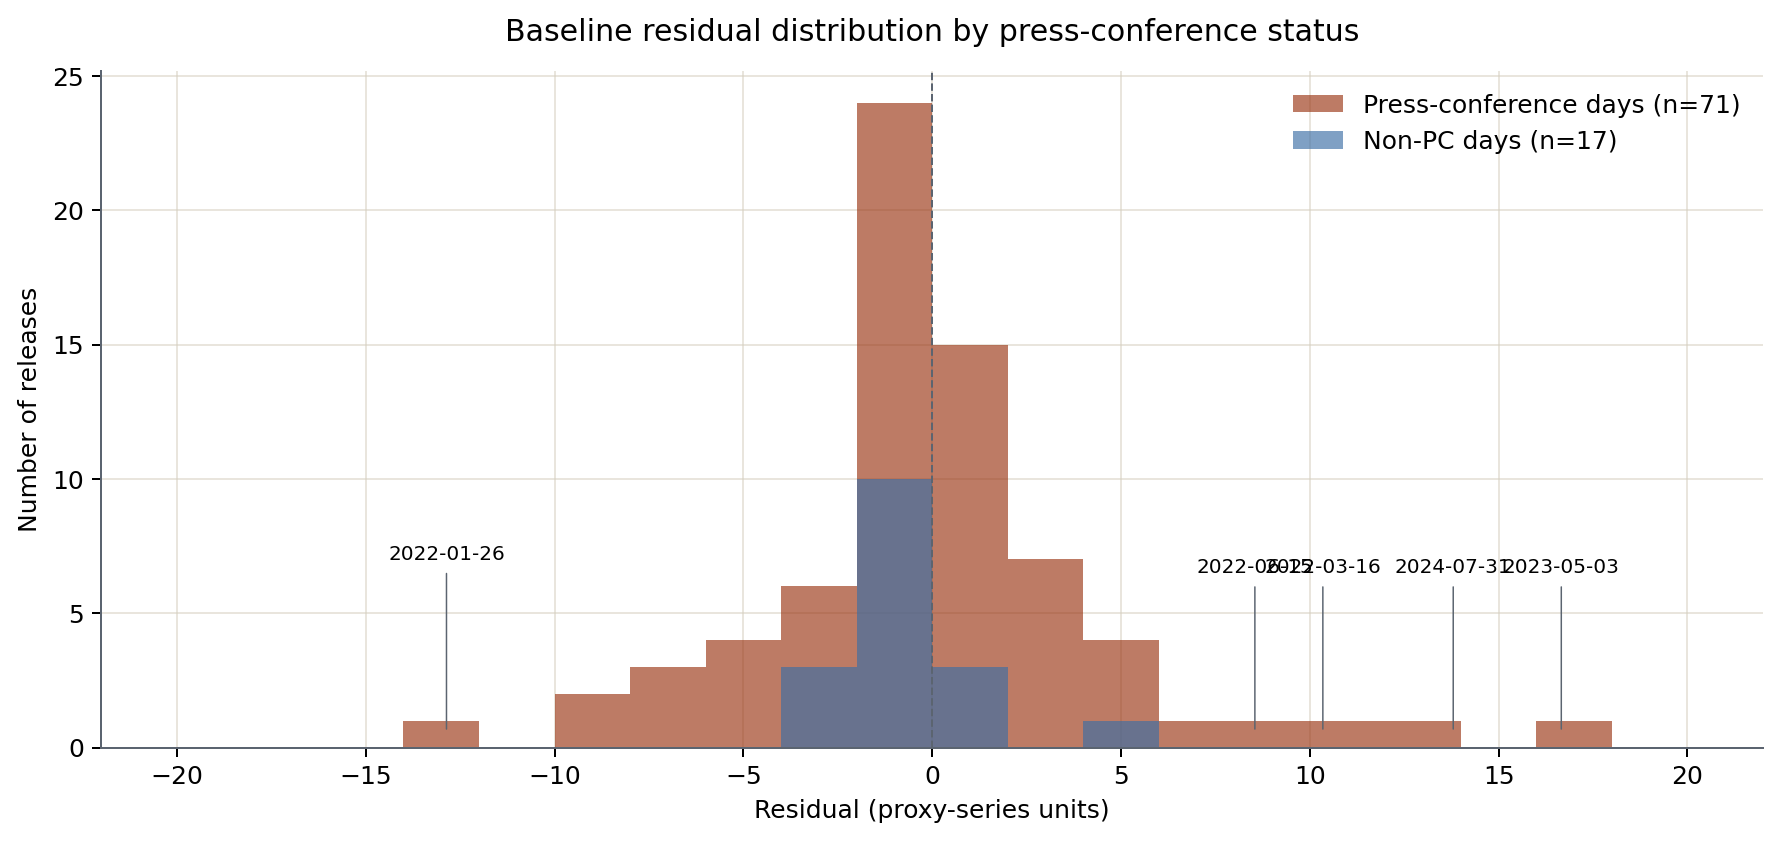
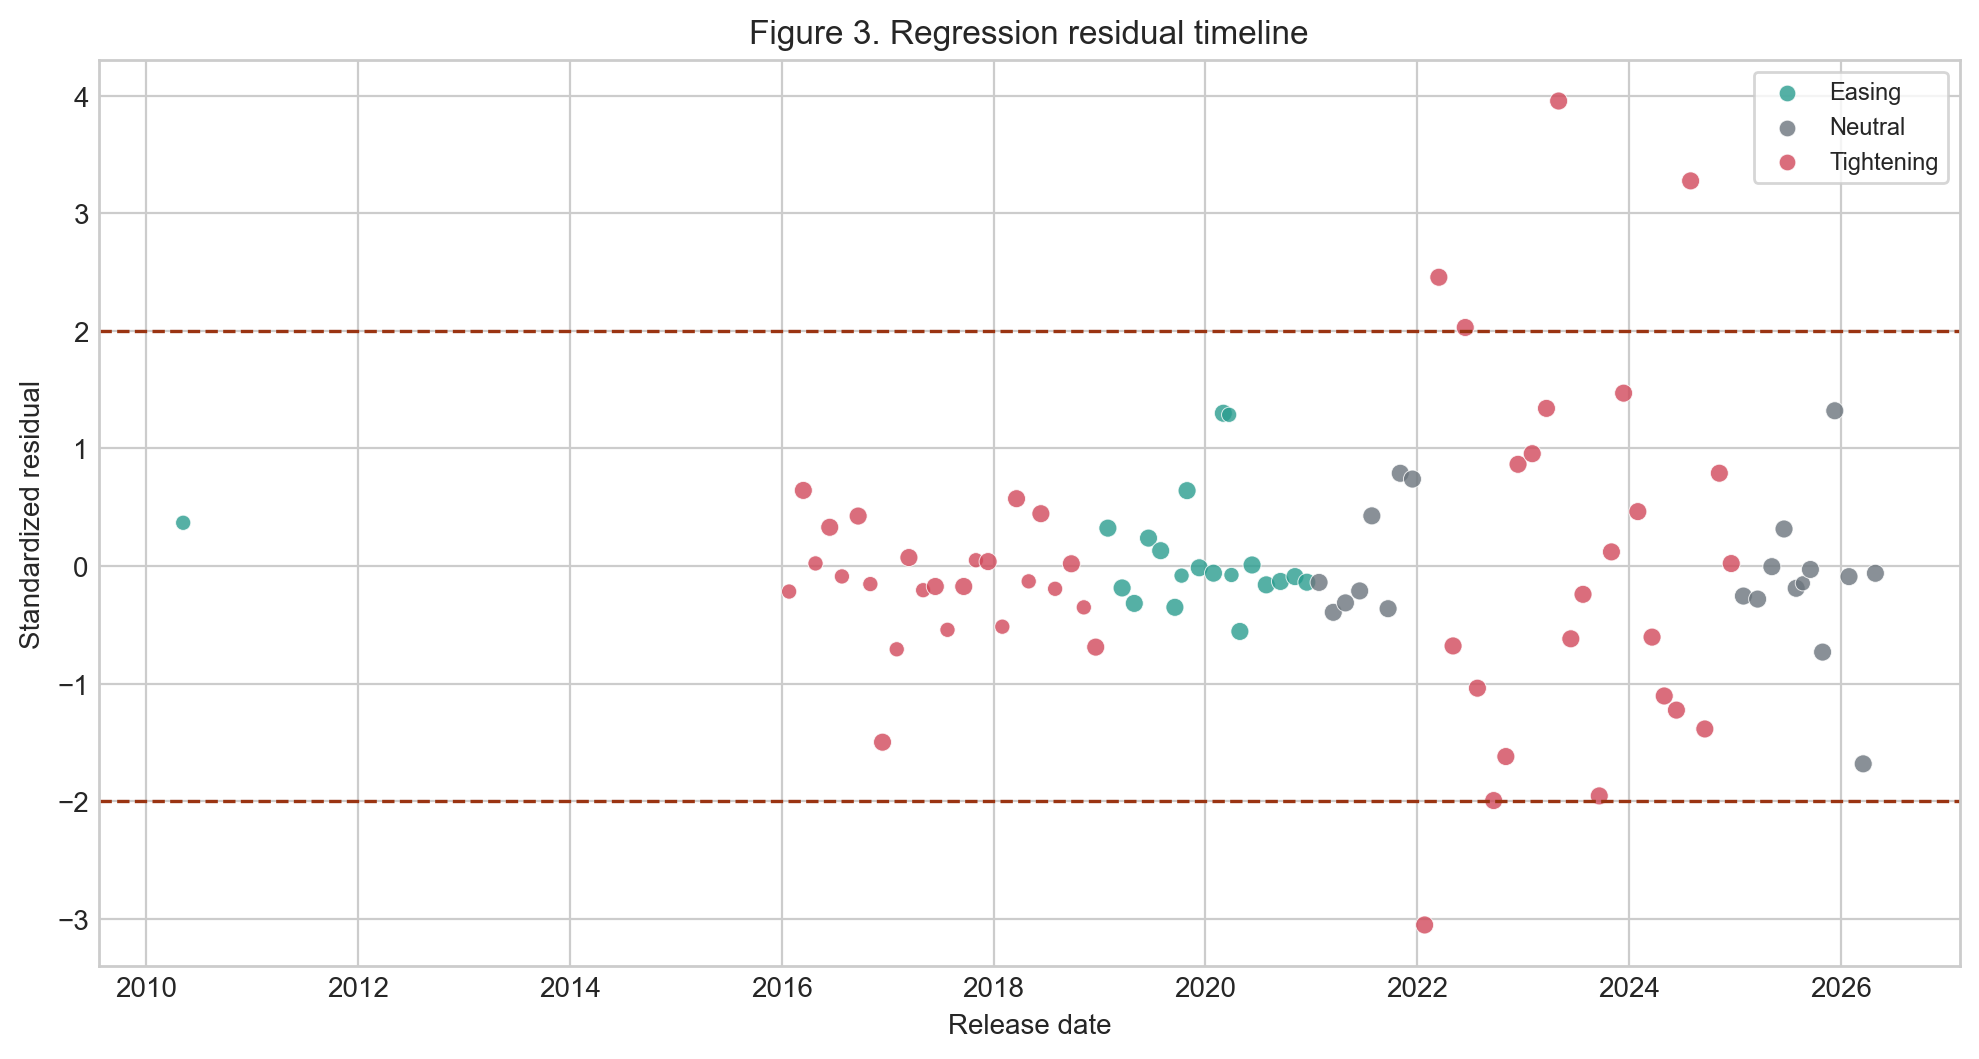
The five releases with the largest absolute baseline residuals all fall on scheduled press-conference days (Table 4). The single largest residual is the 2023-05-03 meeting (+16.66 proxy units, $+3.95\sigma$), a tightening-cycle release in which the proxy moved sharply hawkish while the statement-text delta was essentially zero. Four of the five top residuals come from the 2022 hiking cycle.
| Release date | Cycle | Press conf. | Residual | Std. residual | $\Delta y^{[-15,+15]}$ |
|---|---|---|---|---|---|
| 2023-05-03 | Tightening | yes | $+16.66$ | $+3.95$ | $+17.58$ |
| 2024-07-31 | Tightening | yes | $+13.80$ | $+3.27$ | $+14.45$ |
| 2022-01-26 | Tightening | yes | $-12.86$ | $-3.05$ | $-12.11$ |
| 2022-03-16 | Tightening | yes | $+10.35$ | $+2.46$ | $+11.33$ |
| 2022-06-15 | Tightening | yes | $+8.55$ | $+2.03$ | $+8.98$ |
Figure 6 shows the residual distribution split by press-conference status. The 17 non-press-conference releases produce a tight residual distribution concentrated around zero; the 71 press-conference releases produce the heavy left and right tails that drive the baseline's near-zero $R^{2}$. Figure 9 (Appendix) places these residuals on a date axis and confirms the clustering in 2022–2024.
8. Press-Conference Window
Because all five top residuals fall on press-conference days, we re-fit the regression with the dependent variable shifted into the press-conference window itself. We define
which excludes the statement-read window and captures the first 60 minutes of press-conference content. Federal Reserve press conferences began in April 2011 and have started 30 minutes after the statement release since the Powell era. Of the 71 press-conference days with complete coverage in both the statement and press-conference windows, the baseline regression on the statement window keeps its negative sign ($\hat{\beta}=-3.82$, $p=0.272$, $R^{2}=0.008$), but the regression on the press-conference window flips:
The press-conference slope is still not statistically distinguishable from zero, but its sign now matches the economic prior and its $R^{2}$ is roughly triple the baseline. Figure 7 contrasts the two scatter plots side by side.
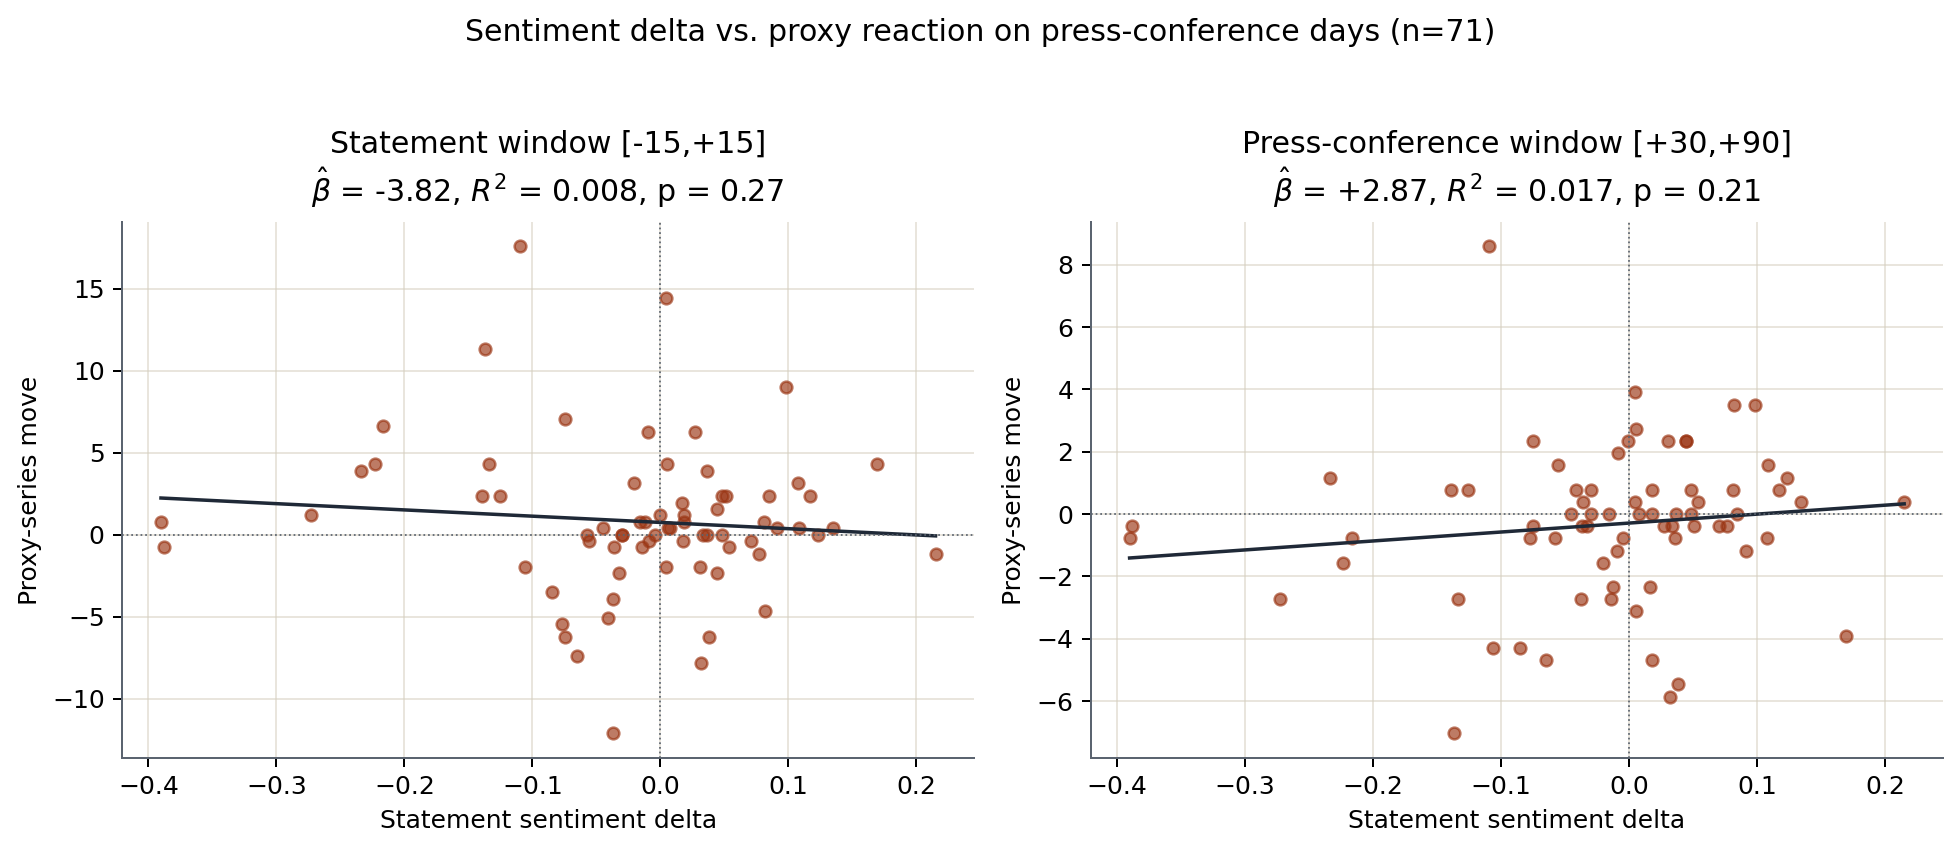
The natural reading is that whatever signal FinBERT-coded statement tone contains about market-moving Fed information is most visible during the press-conference window, not the statement-read window. This is consistent with the residual evidence: on a day with both a statement and a press conference, the marginal information embedded in the prepared statement is small relative to the press-conference Q&A, and the +30-minute statement-read window is short enough to miss most of the price discovery.
9. Discussion
Three explanations are consistent with the headline null. First, the intraday market leg is a Treasury futures proxy, not the cash 2-year yield: the proxy correlates strongly with cash yields at low frequency, but minute-level moves can include futures-specific microstructure that washes out an underlying yield signal. Second, the largest absolute proxy moves in the included sample fall on days that host both a statement and a press conference. The $[-15,+15]$ window is too narrow to capture press-conference content, which begins thirty minutes after the statement release, but the proxy-series move within that window is already starting to incorporate anticipated press-conference language; Section 8 provides direct evidence by re-targeting the dependent variable into the press-conference window itself, where the slope flips sign and the explained variance triples. Third, the FinBERT classifier was trained on broad financial text rather than Fed statements: the 0.42 dovish recall implies systematic mis-classification of policy-easing language as hawkish, which contaminates $\Delta S_t$ in exactly the meetings—early-cycle dovish pivots—where statement-text content is most likely to matter.
The cleanest defensible sentence about this dataset is therefore:
A $[-15,+15]$ minute window around the statement release identifies no measurable relationship between FinBERT-coded statement sentiment deltas and the 30-minute proxy-yield response in 88 FOMC releases between 2010 and April 2026. The five largest absolute residuals all occur on press-conference days, and re-targeting the dependent variable onto the $[+30, +90]$ press-conference window flips the slope to the expected sign and roughly triples the explained variance, though the effect remains statistically indistinguishable from zero.
10. Limitations and Next Steps
Several caveats apply to the headline result. The intraday market series is the front-month 2-year Treasury futures contract, so reported magnitudes are not directly interpretable as cash 2-year basis points. Fifty of the 138 discovered statements (predominantly 2010–2015, plus two crisis-period releases with inadequate intraday coverage) drop out of the baseline sample because the official page does not publish a release minute or because no intraday bar falls within tolerance of the event. The hand-coded validation flags a class-recall shortfall on dovish content (recall 0.424, below the 0.45 floor specified for this analysis): out-of-domain FinBERT systematically over-predicts hawkish in Fed text. The easing and neutral cycle strata contain only twenty releases each, and the tightening stratum's HAC standard error is inflated by the cluster of post-2021 outliers. Finally, the 800-sentence validation pool was hand-coded by a single annotator without a second adjudication pass over disagreements.
11. Reproducibility
The sentiment scorer is ProsusAI's FinBERT model pinned to a fixed revision hash so that re-scoring the statement corpus reproduces identical sentence-level probabilities. The intraday market series is a 30-minute nearby front-month 2-year Treasury futures contract, and the Federal Reserve's H.15 daily 2-year constant-maturity yield is retained as a low-frequency reference series only. Each baseline regression is fit by OLS with HAC standard errors at a one-lag setting. The press-conference window analysis in Section 8 runs as a standalone extension on top of the main event-study procedure, taking the same intraday bar set and the same sentiment deltas as inputs.
A. Validation Appendix
B. Residual Timeline
C. Sample-Construction Detail
| Cycle | All discovered | Verified minute | Baseline included |
|---|---|---|---|
| Easing | 70 | 22 | 20 |
| Neutral | 20 | 20 | 20 |
| Tightening | 48 | 48 | 48 |
| Total | 138 | 90 | 88 |
References
- Araci, D. (2019). FinBERT: Financial Sentiment Analysis with Pre-trained Language Models. arXiv:1908.10063.
- Bauer, M. D. and Swanson, E. T. (2023). A Reassessment of Monetary Policy Surprises and High-Frequency Identification. NBER Macroeconomics Annual.
- Cieslak, A., Morse, A., and Vissing-Jørgensen, A. (2019). Stock Returns Over the FOMC Cycle. Journal of Finance, 74(5), 2201–2248.
- Gürkaynak, R. S., Sack, B., and Swanson, E. T. (2005). Do Actions Speak Louder Than Words? The Response of Asset Prices to Monetary Policy Actions and Statements. International Journal of Central Banking, 1(1), 55–93.
- Hansen, S., McMahon, M., and Prat, A. (2018). Transparency and Deliberation within the FOMC: A Computational Linguistics Approach. Quarterly Journal of Economics, 133(2), 801–870.
- Husted, L., Rogers, J., and Sun, B. (2020). Monetary Policy Uncertainty. Journal of Monetary Economics, 115, 20–36.
- Kuttner, K. N. (2001). Monetary Policy Surprises and Interest Rates: Evidence from the Fed Funds Futures Market. Journal of Monetary Economics, 47(3), 523–544.
- Loughran, T. and McDonald, B. (2011). When Is a Liability Not a Liability? Textual Analysis, Dictionaries, and 10-Ks. Journal of Finance, 66(1), 35–65.
- Nakamura, E. and Steinsson, J. (2018). High-Frequency Identification of Monetary Non-Neutrality: The Information Effect. Quarterly Journal of Economics, 133(3), 1283–1330.